|
Ronald Mak
Department of Computer Engineering
|
| Week | Date | Content |
|---|---|---|
| 1 | Jan 28 |
Zoom recording
Password: n?3dCh7M
Slides: Introduction to data analytics; What is Data Science? history of data collection; history of data analysis; Python libraries; datasets; load CSV files into dataframes; statistics and machine learning; data scientist skillset; Lab: Install Anaconda Lab: Load CSV datasets into dataframes Jupyter notebooks: TitanicCSV.ipynb AirlineSafetyCSV.ipynb BostonCrimeCSV.ipynb CSV files: crimes-in-boston.zip |
| 2 | Feb 4 |
Zoom recording
Password: kD=CSP22
Slides: Big Data; Jupyter notebooks; IPython; lists; indexing; length; mutable; two-dimensional, tuples; unpack; slice; sort; search; list comprehension; list operations; numpy arrays; Seaborn; histogram vs. bar chart; random values Lab: Seaborn Histograms Jupyter notebooks: AgeBarChart.ipynb 5.02-Lists.ipynb 5.03-Tuples.ipynb 5.04.Unpacking.ipynb 5.05-Slicing.ipynb 5.06-Deletion.ipynb 5.08-Sorting.ipynb 5.09-Searching.ipynb 5.10-OtherOperations.ipynb 5.12-Comprehensions.ipynb 5.16-TwoDimensionalLists.ipynb |
| 3 | Feb 11 |
Zoom recording
Password: iT$5aBW&
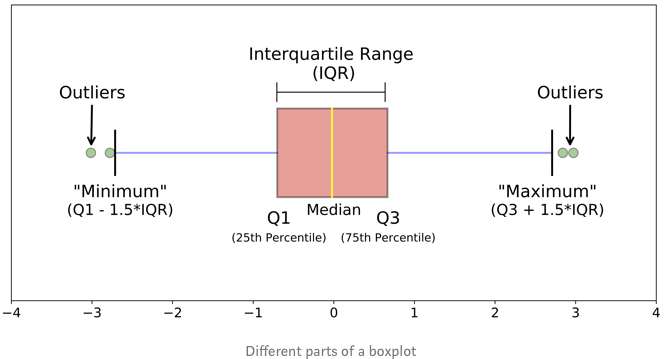
Slides: Statistics; sums; measures of central tendency; mean; weighted average; median; mode; measures of variability; range; percentiles; quartiles; interquartile range (IRQ); variance; standard deviation; zip; data analysis with the Titanic Survival dataset Lab: Descriptive Statistics Jupyter notebooks: sum.ipynb mean.ipynb weighted_average.ipynb median.ipynb mode.ipynb range.ipynb quartiles.ipynb IQR.ipynb stdev.ipynb ziptest.ipynb TitanicAnalysis.ipynb TitanicSurvival.csv boxplot.png "Analysis of California County Expenditures" |
| 4 | Feb 18 |
Zoom recording
Password: QAO^X4.3
Slides: Counting principles; factorial notation; count the complement; counting when order doesn't matter; binomial coefficients; collections that allow repetitions; permutations and combinations; uncertainty; probability: classical and relative frequency interpretations; basic probability laws; Venn diagrams Lab: Combinatorics and probability problem set |
| 5 | Feb 25 |
Zoom recording
Password: ?g?BPsM5
Slides: Conditional probability; independent vs. dependent events; Bayes' Theorem; Thomas Bayes and Bayesian statistics; disease test example; Monty Hall Problem; discrete and continuous random variables; probability distributions: uniform, normal, exponential, binomial, Poisson; expected value; animated graphs Lab: Probability problem set Python program: RollDieDynamic.py Jupyter notebook: PltAnimation.ipynb |
| 6 | Mar 4 |
Zoom recording
Password: 19%tkcr+
Slides: Computer simulations; Monty Hall simulation program; Monty Hall with n doors and k cars; statistics; sampling; random vs. biased sampling; sampling error; estimates of the population mean; the Central Limit Theorem; sampling distribution of the sample means; number of samples; size of samples; standard error; sampling distributions of the mean, median, and standard deviation Lab: Central Limit Theorem Jupyter notebook: MontyHall.ipynb |
| 7 | Mar 11 |
Zoom recording
Password: S5t.=R=A
Slides: Discrete vs. continuous random variables; area under the curve; normal probability distribution; standard normal distribution; standard normal distribution probabilities; confidence interval; critical values; level of significance; margin of error; small sample estimates; Student's t distribution; t confidence interval; interpretation of confidence intervals; hypothesis testing; test procedure; Type I and Type II errors; test statistic; null hypothesis rejection regions; hypothesis testing examples Jupyter notebook: StandardNormal.ipynb Fall 2020 midterm: Midterm-Fall2020.ipynb Midterm-Fall2020-Solution.ipynb |
| 8 | Mar 18 |
Midterm
Zoom recording Password: mt@^5F5L Slides: Null vs. alternative hypothesis; small sample hypothesis tests; testing two population means with large and small samples |
| 9 | Mar 25 |
Zoom recording
Password: EX==qiw8
Slides: Tactics for solving probability problems; midterm solutions; hypothesis testing and experiments; different significant levels; using P-values; dependent and independent variables; scatter plots; regression analysis; regression line; slope-intercept; residual values; least-squares line; coefficient of determination; correlation coefficient; correlation and causation; Assignment #7 Midterm solutions: midterm solutions Jupyter notebooks: ScatterPlot.ipynb LeastSquaresLine.ipynb CoeffOfDet.ipynb Correlation.ipynb |
| 10 | Apr 8 |
Zoom recording
Password: u6NxB?.i
Slides: Python regression analysis functions; NY City temperatures example; time-series analysis; linear trend over time; moving averages; exponential smoothing; another perspective on linear regression; multiple linear regression; normal equations; home prices example; introduction to machine learning; supervised; unsupervised; steps for doing ML; time-series analysis via ML example; split the data; train the estimator; test the model; make predictions; multiple regression via ML; California housing example; underfitting and overfitting; Jupyter notebooks: NYCTemps.ipynb TimeSeries.ipynb HomePrices.ipynb NYCTempsML.ipynb CaliforniaHousing.ipynb Least squares module: LeastSquaresLine.py Dataset: nyc_avg_jan_1895-2021.csv |
| 11 | Apr 15 |
Zoom recording
Password: WfaSn6&J
Slides: scikit-learn machine learning algorithms; "Big Data"; supervised ML; k-nearest neighbor ML classification algorithm with the Digits dataset; training and testing the KNN model; confusion matrix; classification report; unsupervised ML; dimensionality reduction; TSNE estimator; k-means clustering algorithm with the Iris dataset; principal component analysis; Assignment #9; very brief introduction to Python natural language processing Jupyter notebooks: k-NearestNeighbors.ipynb k-DimensionalityReduction.ipynb k-MeansClustering.ipynb Natural language processing: nlp.zip |
| 12 | Apr 22 |
Zoom recording
Password: J2D7&UjL
Slides: Linear algebra; vectors; vector arithmetic; normalize a vector; vectors and NumPy; matrices; matrix arithmetic; matrix inverse; matrices and NumPy; Hilbert matrices; graphic transformation matrix; linear equations; home prices example; solve a system of linear equations; equivalent systems; graphical solution; consistent and inconsistent systems; ill-conditioned systems; augmented matrix solution; row echelon form; Gaussian elimination solution to home housing prices; solution using Python Jupyter notebooks: NumPy.ipynb Vectors.ipynb Matrices.ipynb LinearAlgebra.ipynb MatrixInverse.ipynb Hilbert.ipynb TransformationMatrix.ipynb HomePricesSolve.ipynb |
| 13 | Apr 29 |
Zoom recording
Password: .?tqX0vH
Slides: Matrix representation; calculate a matrix inverse; solution using an inverse; singular matrix and system; least-squares solution with matrices; Gram-Schmidt Orthonormalization Process; QR factorization and least squares; LU decomposition; singular value decomposition (SVD) Jupyter notebooks: LinearEquationPlots.ipynb MatrixInverse.ipynb LeastSquaresMatrix.ipynb MultivariateMatrix.ipynb QR.ipynb LU.ipynb SVD.ipynb Splines.ipynb |
| 14 | May 6 |
Zoom recording
Password: wJ2q?C8&
Slides: Nonlinear relationships; normal equations; polynomial regression; polynomial regression with matrices and QR factorization; Markov chain; Markov steady state Jupyter notebooks: PolynomialRegression.py PolynomiaRegression1.ipynb PolynomiaRegression2.ipynb PolynomiaRegression3.ipynb PolynomiaRegression4.ipynb PolynomialRegressionMatrices.ipynb MarkovChain.ipynb |
| 15 | May 13 |
Zoom recording
Password: 52Sphr&P
Slides: Eigenvalues and eigenvectors; uses; geometric interpretations; normalized eigenvectors; compute eigenvalues; compute eigenvectors; numpy.linalg.eig() function; matrix powers; optimization for machine learning; linear regression example; Nelder-Mead algorithm; gradients, gradient descent; optimization with Python; logistic regression Jupyter notebooks: EigenFactorization.py MatrixPowers.py VectorPlots.ipynb TestEigenFactorization1.ipyn TestEigenFactorization2.ipyn TestEigenFactorization3.ipyn TimeEigen.ipynb TestMatrixPower.ipynb LeastSquaresOptimization.ipynb GlobalOptimization.ipynb LogisticRegression.ipynb |
Instructor consent.
|
Introduction to Statistics & Data Analysis,
6th edition Roxy Peck, Tom Short, and Chris Olsen Cengage, 2019 978-1-337-79361-2 |
|
Linear Algebra: A Modern Introduction,
4th edition David Poole Cengage Learning, 2015 978-1-285-46324-7 |
|
Linear Algebra (Schaum’s Outline),
6th edition Seymour Lipschutz and Marc Lipson McGraw-Hill, 2018 978-1-260-01144-9 |
|
Data Science from Scratch: First Principles with
Python, 2nd edition Joel Grus O’Reilly, 2019 978-1-492-04113-9 |
|
Python Data Science Handbook Jake VanderPlas O’Reilly, 2017 978-1-491-91205-8 |