Chris Pollett >
Students >
Swathi
( Print View)
[Bio]
[Blog]
[D1:Dataset Overview - pdf(ipynb)]
Deliverable 2:Classification and Clustering on Heart Data
Description:
This deliverable aimed to implement Clustering and Classification Techniques on Heart data from Tabula Sapiens. Logistic Regression, Support Vector Machine, K-Means and Hierarchical Clustering were performed on the Heart cells data to check for similar groups or clusters.
- Link to IPython Notebook (Please install Anaconda to view ipynb file on Google Colab/ Jupyter Notebook locally)
- Python File for the above notebook
- View Slides - Clustering and Classification
Implementation Steps:
- Download and install Python, Anaconda and Jupyer Notebook.
- Download Tabula Sapiens - Heart Dataset from CZ Biohub website.
- Install anndata, scanpy, numpy, pandas, matplotlib, seaborn python packages.
- Execute the code snippets step by step as mentioned in Google Colab(ipynb) file.
Results:
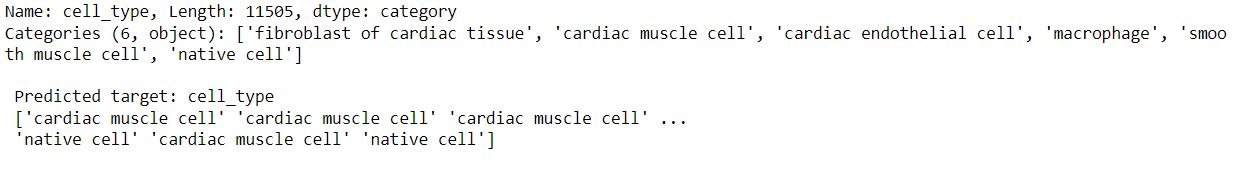
- Implemented Logistic Regression and Support Vector Machine algorithms on Heart cells data to predict the cell type .
- Logistic Regression
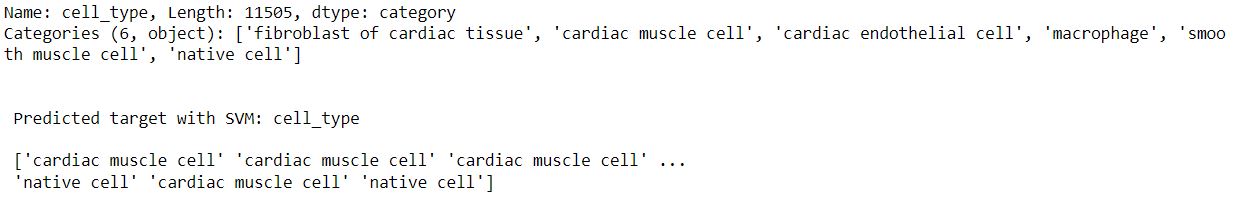
- Support Vector Machine
- K-Means
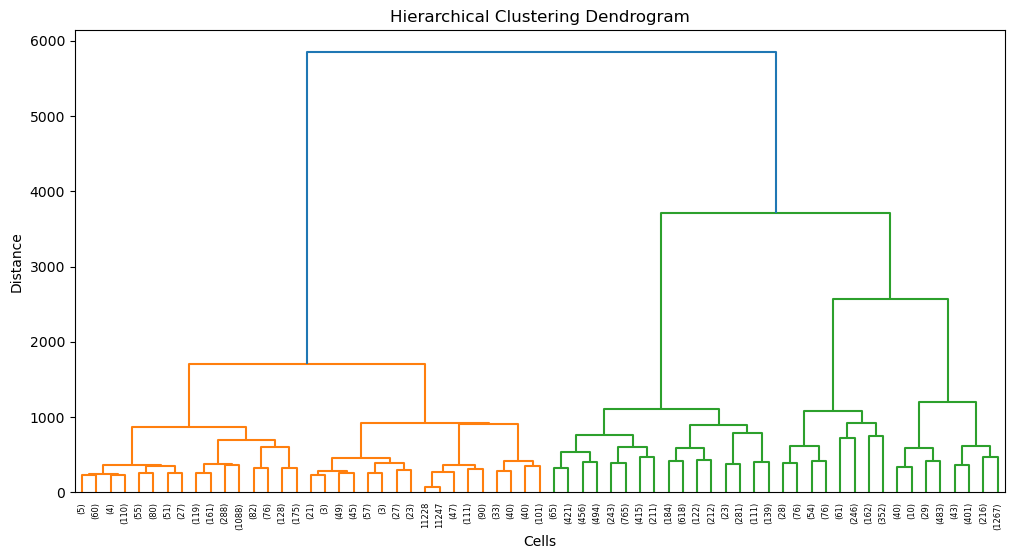
- Hierarchical Clustering
Classification
The Logistic Regression model trained with 1000 iterations gave fairly good results with an accuracy of 98.6% on the test data.
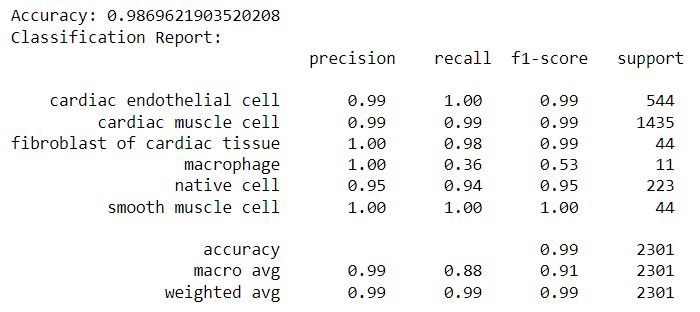
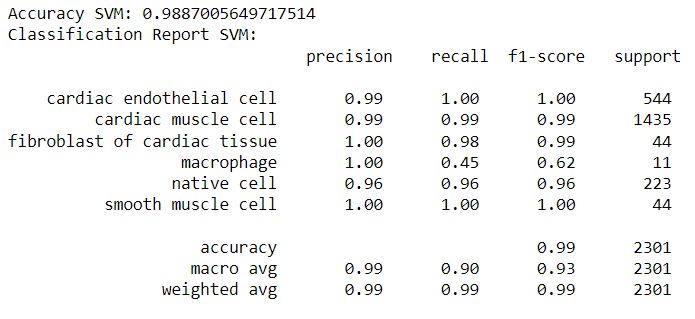
Support Vector Machine using a linear kernel also resulted in an accuracy of 98.8%, slightly better than Logistic regression.
Clustering
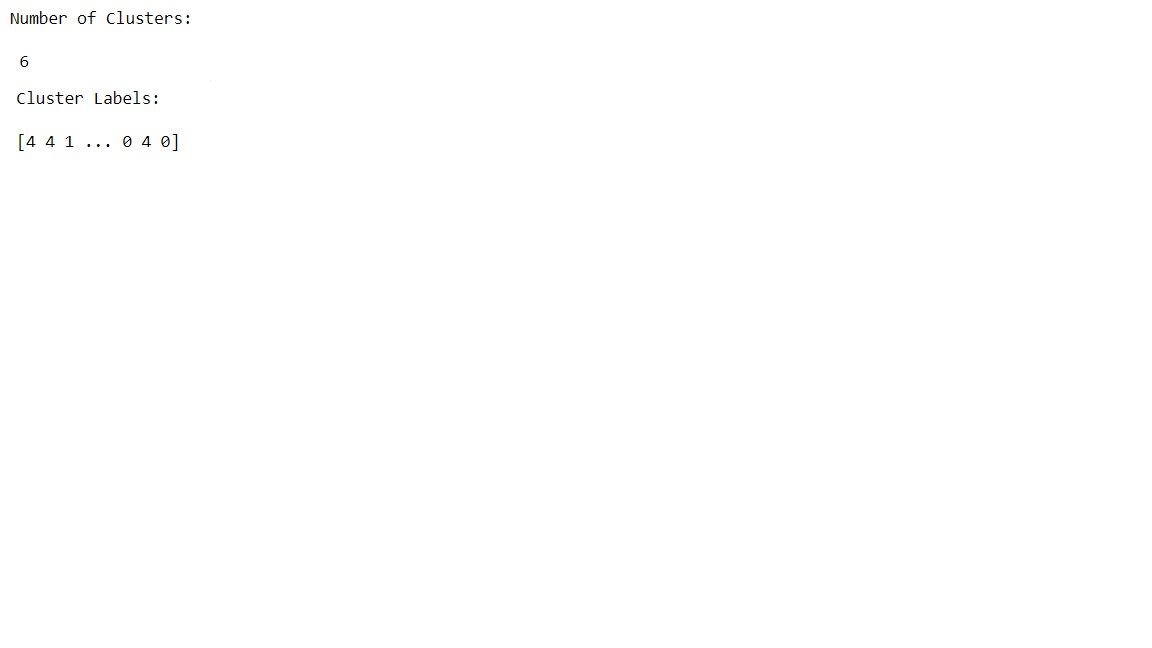
Trained the K-Means model with 6 clusters on the genes of Heart data. Most of the cells were grouped into different clusters
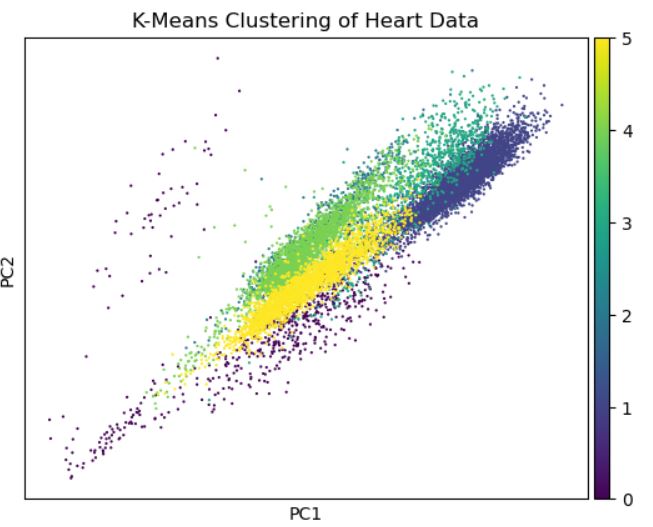
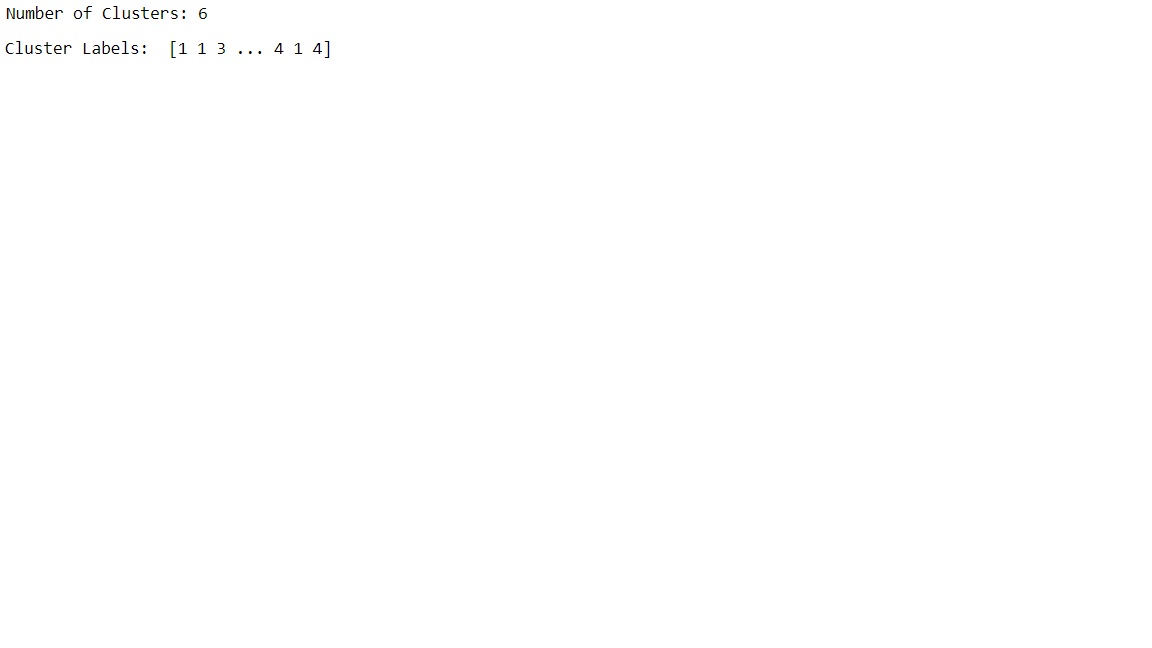
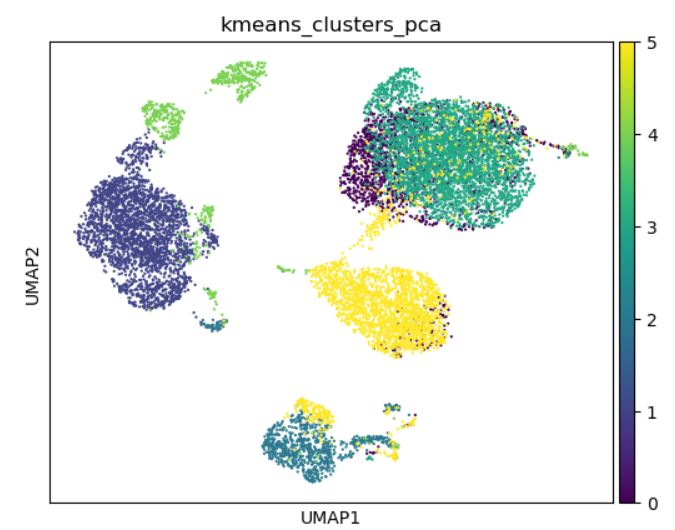
Implemented K-Means with 6 clusters on the first 10 principal components of the genes of Heart data. The clusters can be distinguished better than the ones plotted on actual data
Hierarchical Clustering was done on the Heart cell data with max_distance as 2000. The clusters aren't very clear from the plotted principal components.

The below image shows the dendrogram of the clusters.