Chris Pollett >
Students >
Ivan
( Print View)
[Bio]
[Blog]
[Paper 1: A-Frame Virtual Reality (PDF)]
[Paper 2: ChatGPT - Fundamentals and Applications (PDF)]
[Paper 3: ChatGPT Consistency (PDF)]
Deliverable 4: System Testing and Evaluation
Description:
The goal of this deliverable is to properly evaluate the quantitative and qualitative results of this system. This will include running various test cases and test blocks to accurately measure the success rate of using ChatGPT and A-Frame for 3D modeling purposes. Besides the success rate, we will also use qualitative metrics to determine if the generated entities accurately depict the commands and intent from the user. The evaluation of the system will use GPT 4.0 to determine the model's average success rate and generation relevance for each testing block. This testing will give us a good understanding of the system's capabilities and generation accuracy.
Testing Plan:
-
Evaluation Metrics:
- Success Rate (0.0 - 1.0) - Quantifies the reliability of the system in producing a result upon request
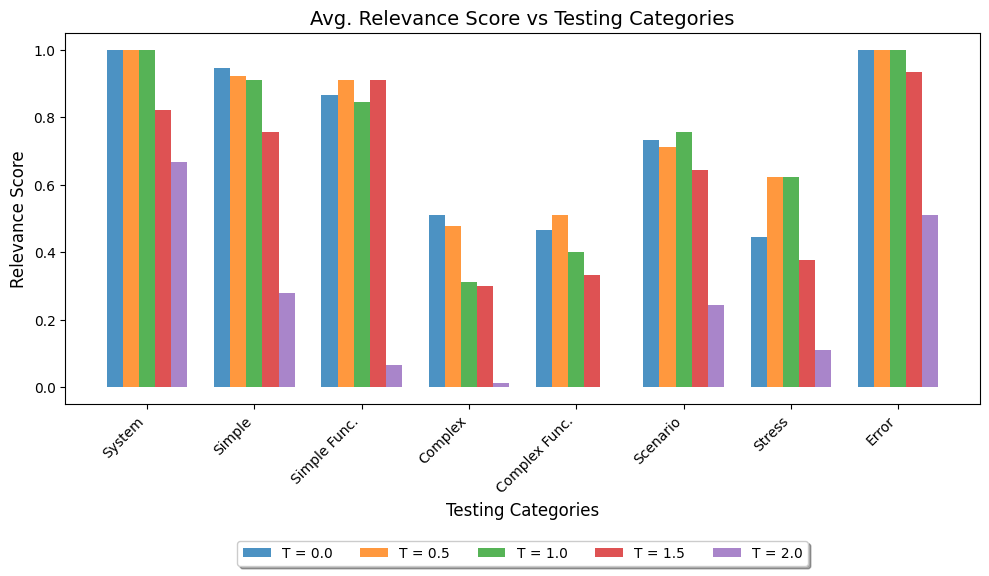
- Relevance Score - Assesses how well the output matches the specific user command or prompt
-
Testing Variables:
- Temperature (Creativity/Randomness) - (0.0, 0.25, 0.5, 0.75, 1.0) - Controls the randomness of responses from the GPT model
-
Testing Categories/Type: (50 Total tests, each test is executed 3 times, Total = 750 test executions)
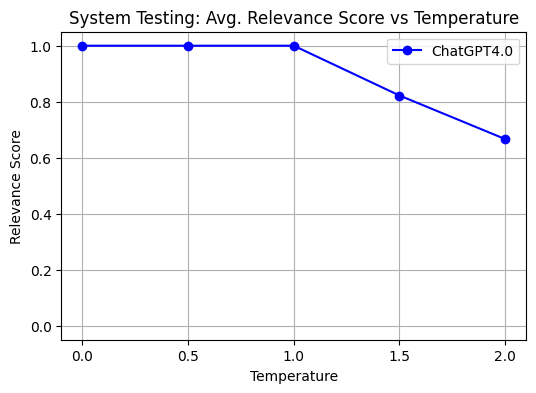
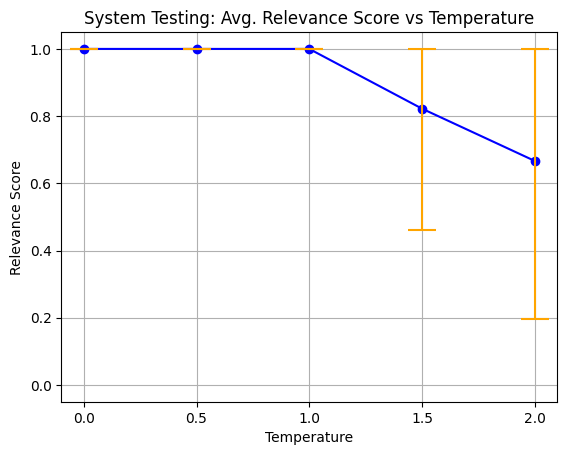
- System Testing (5 Tests)
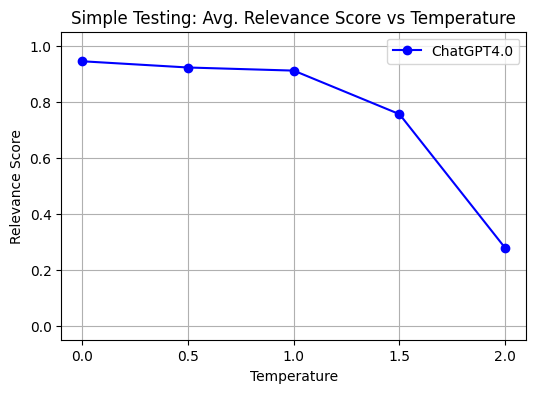
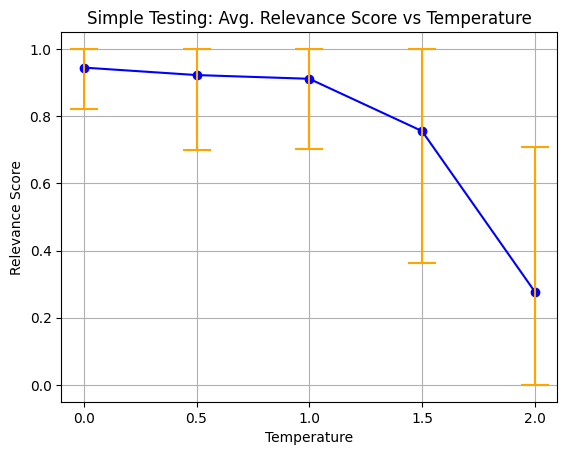
- Simple Generation Testing (10 Tests)
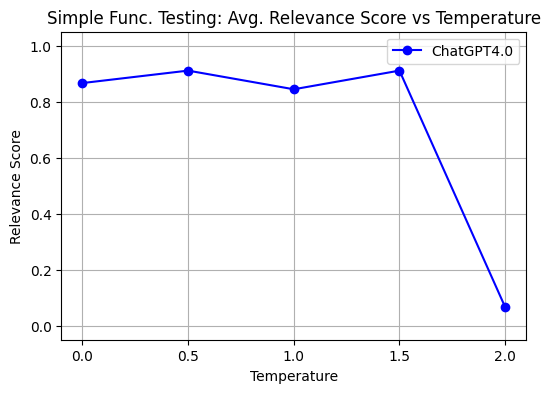
- Simple Functionality Testing (5 Tests)
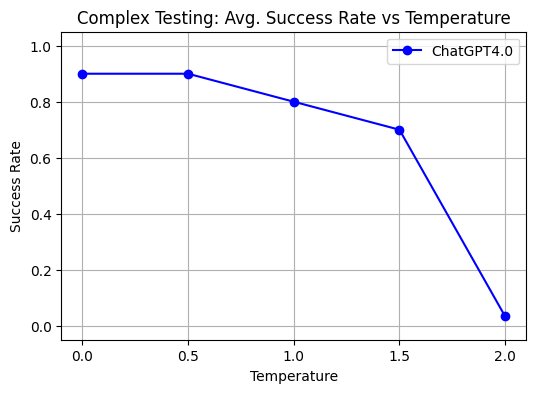
- Complex Generation Testing (10 Tests)
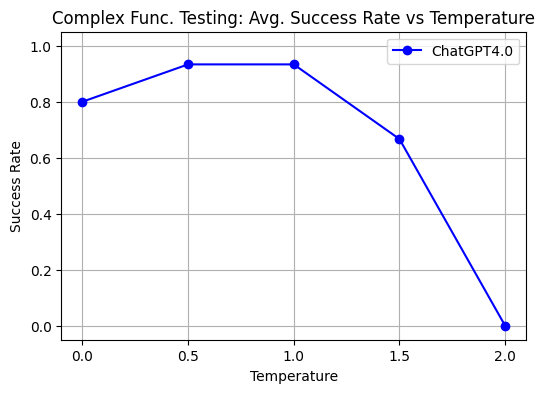
- Complex Functionality Testing (5 Tests)
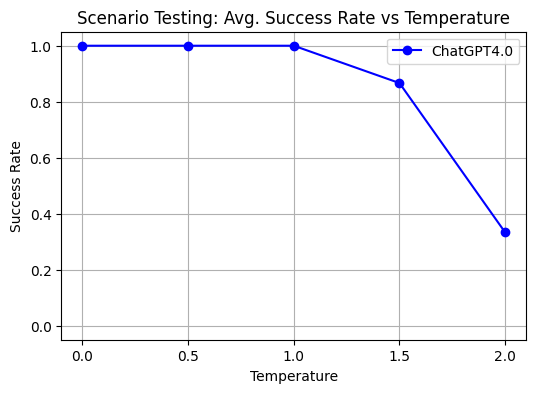
- Scenario/Sequential Testing (5 Tests)
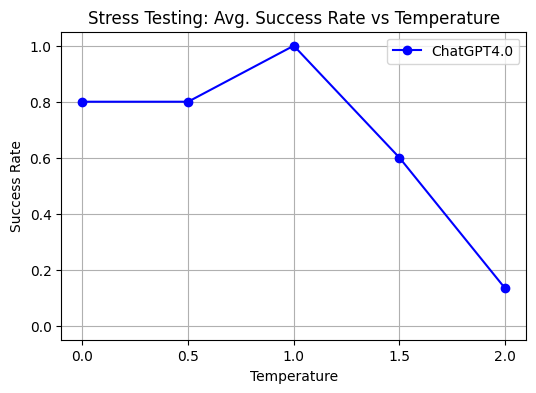
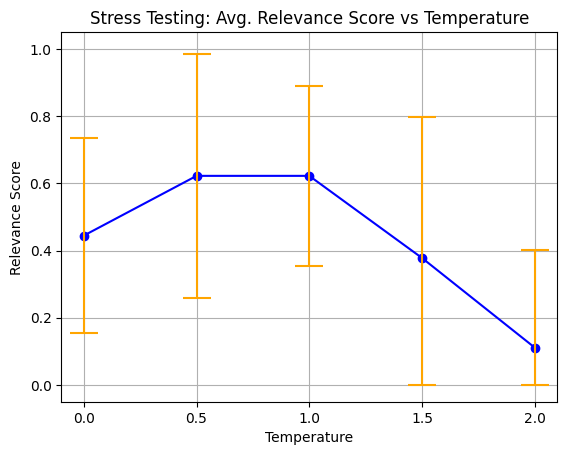
- Stress Testing (5 Tests)
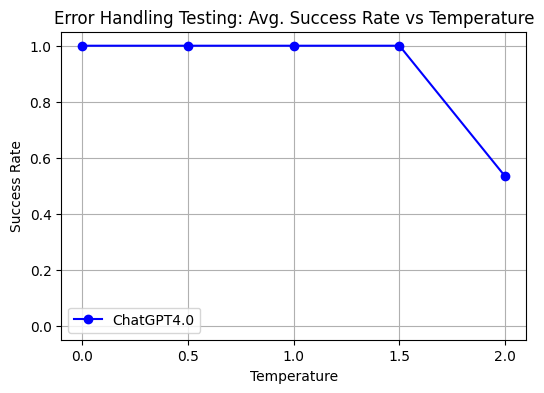
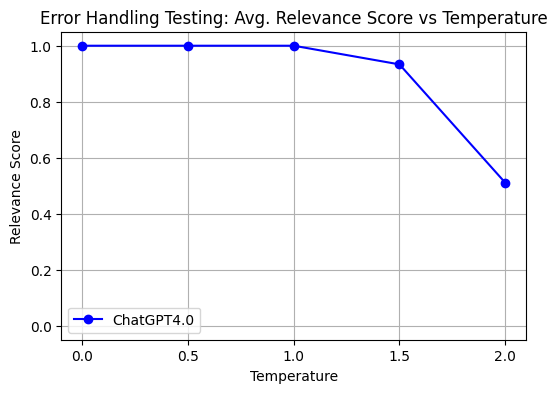
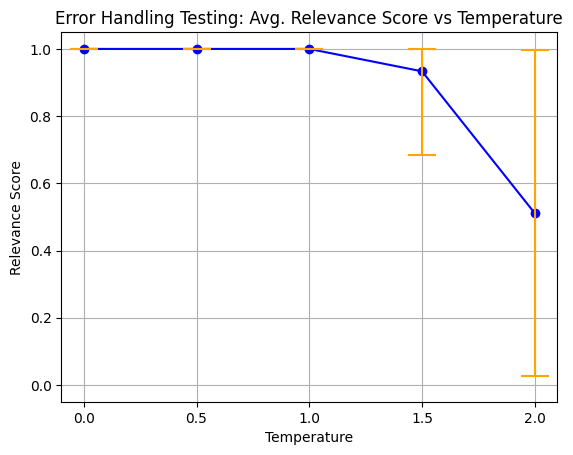
- Error Handling Testing (5 Tests)
-
Metric Visualization Results:
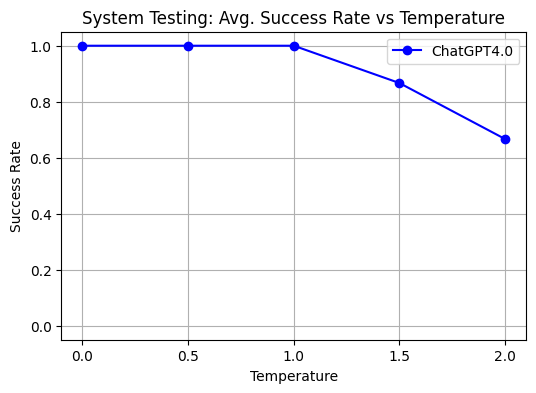
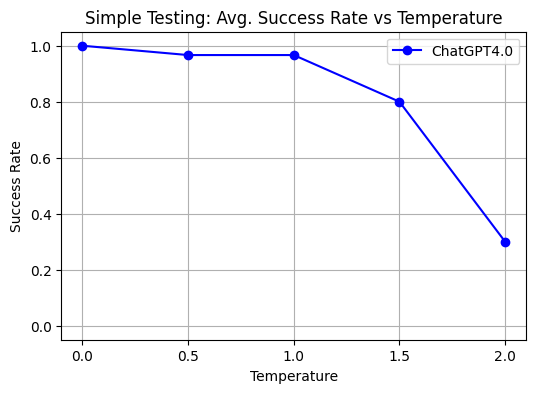
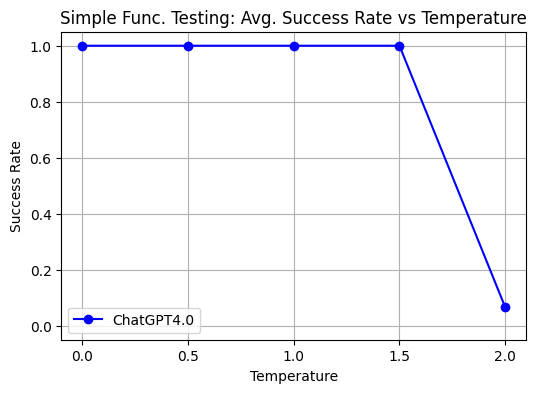
- Quantitative Line Graphs for Success Rate(total 8; one for each testing category)
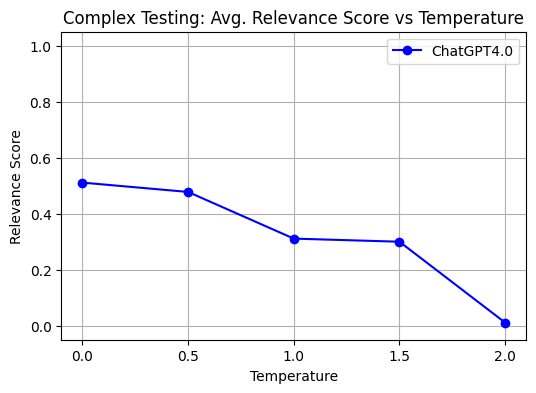
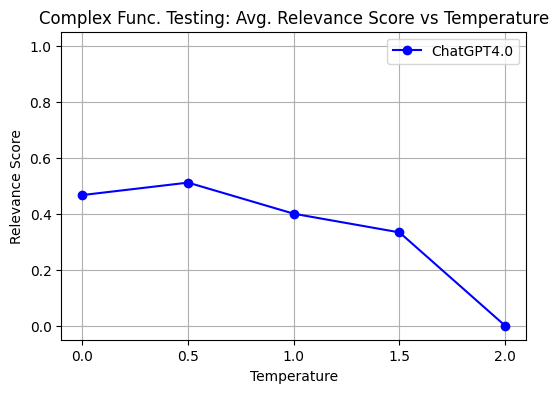
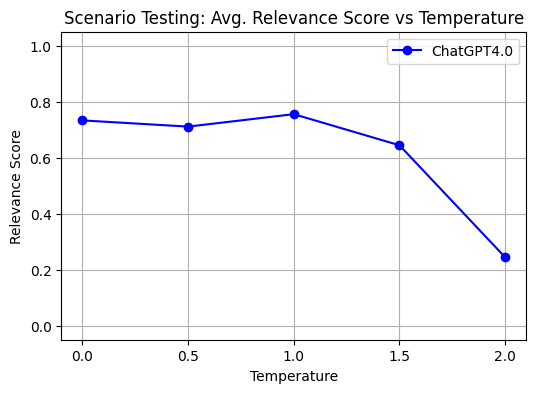
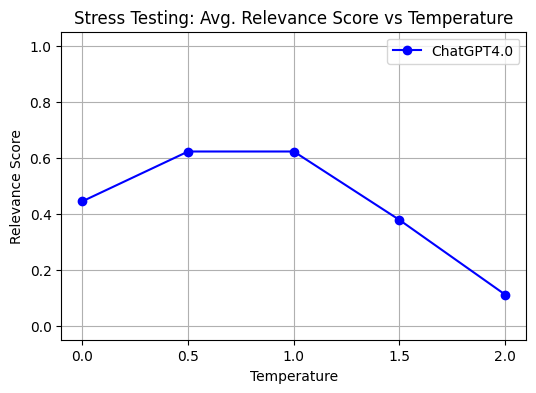
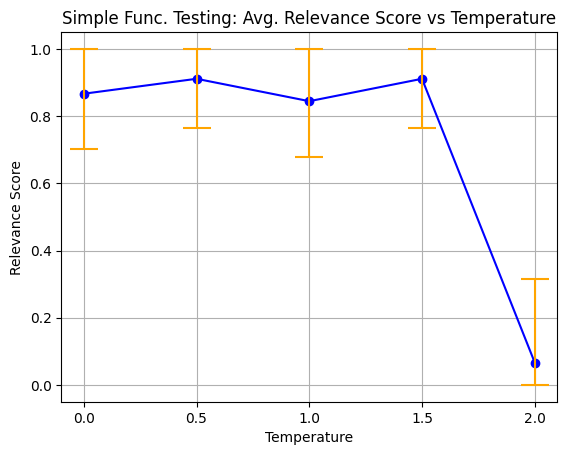
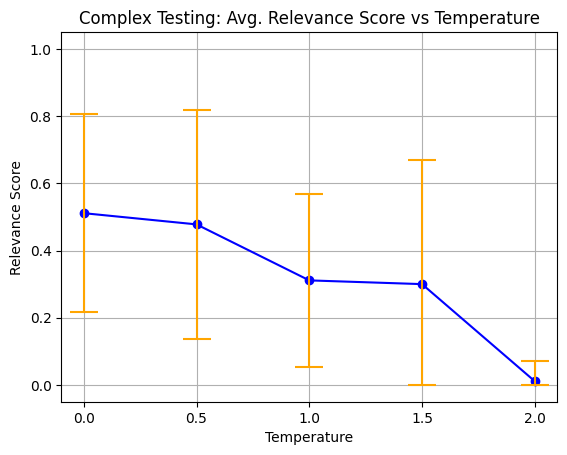
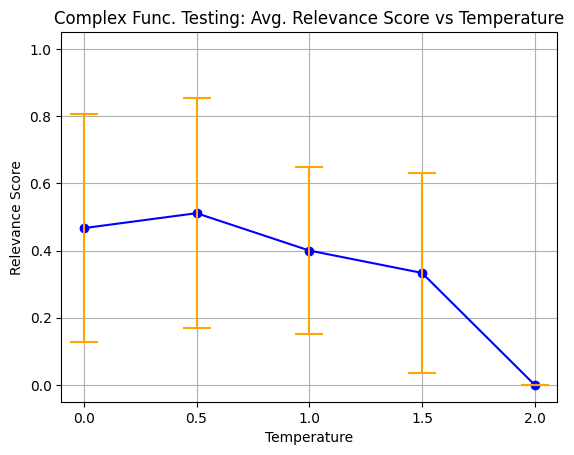
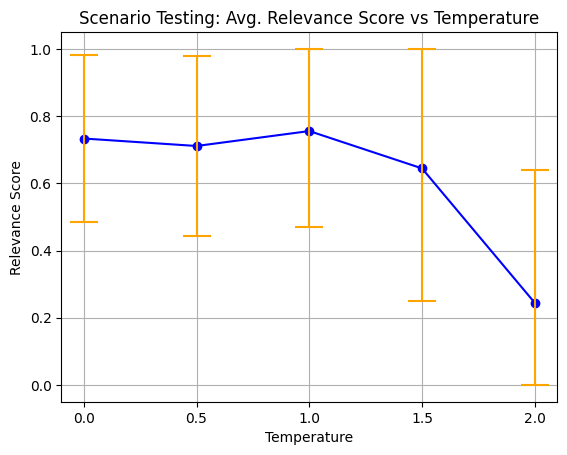
- Qualitative Line Graphs for Relevance Score(total 8; one for each testing category)
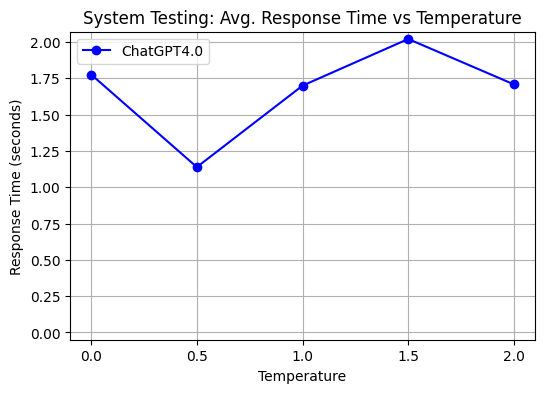
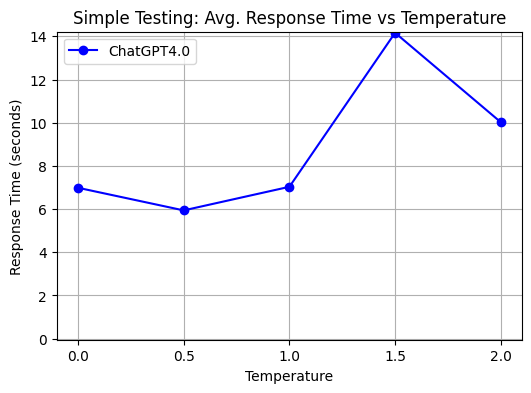
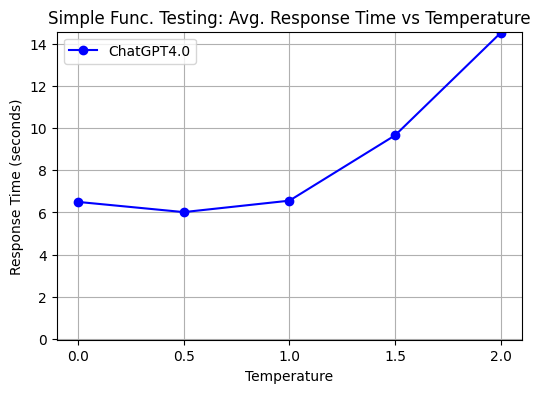
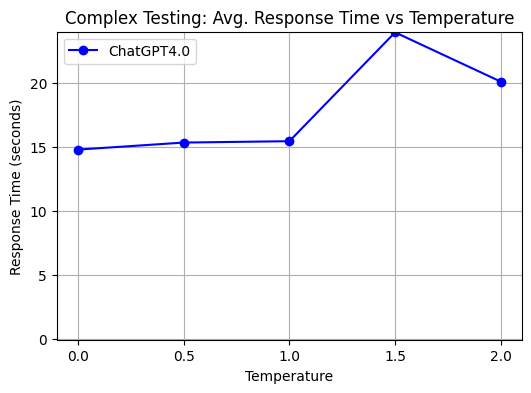
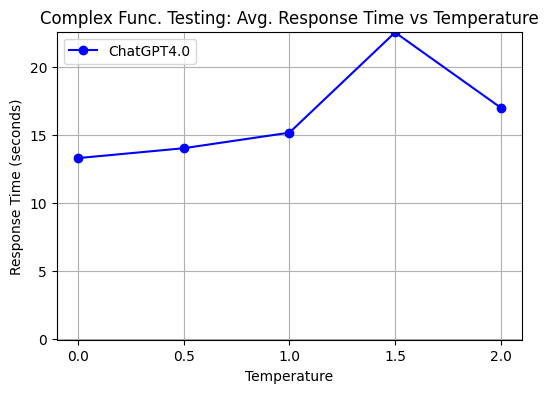
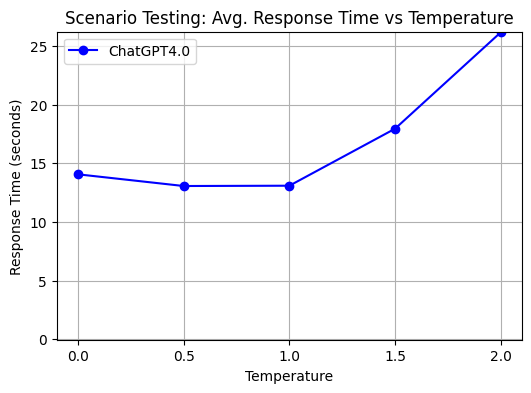
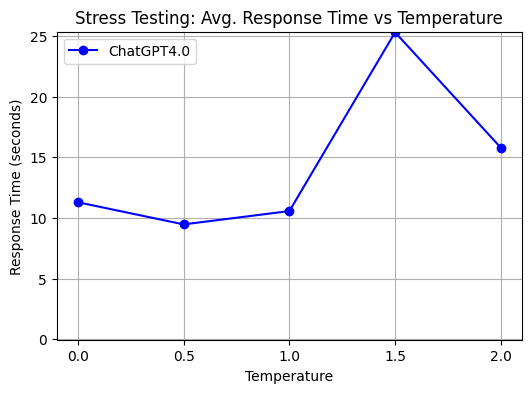
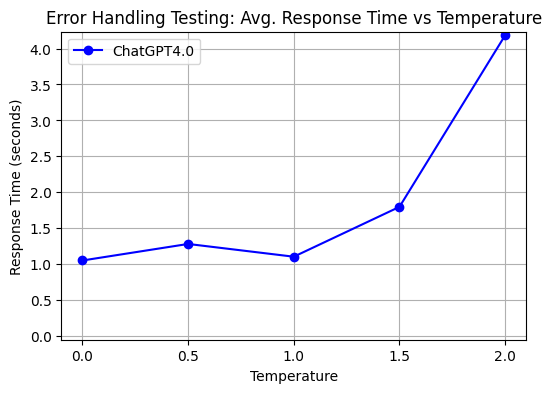
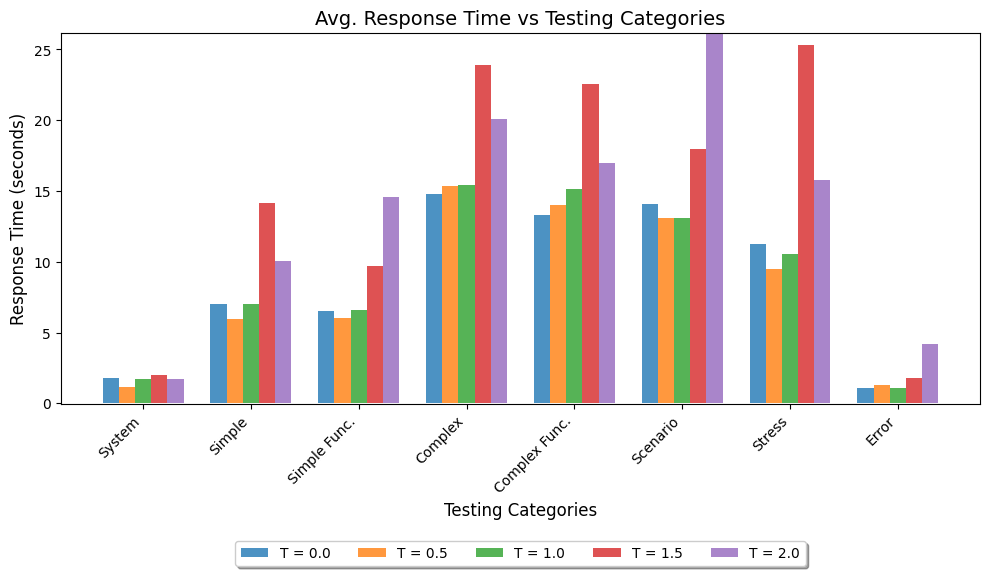
- Performance Analysis Graphs - Measured by average response time from the moment a prompt is sent to the moment a response is received(to measure the system's responsiveness.)
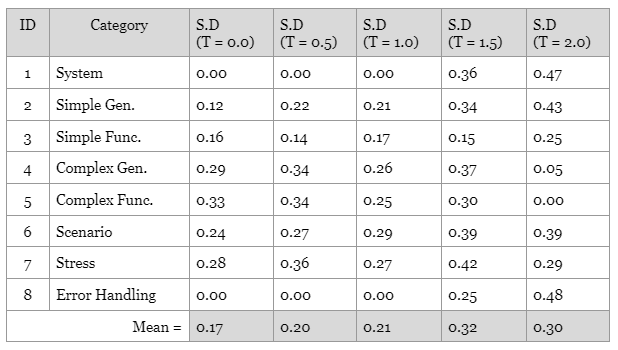
- Error Analysis Graphs - Measuring the standard deviation of the relevance score to evaluate the variance of their quality.
Results:
- Success Rate Graphs:
- Relevance Score Graphs:
- Standard Deviation Graphs and Table:
- Response Time Graphs: