Chris Pollett >
Students >
Tarun Pepira
( Print
View )
[Bio]
Simple Graph using Canvas/SVG
The main task for the deliverable is use a force based algorithm to calculate the positions of the nodes and draw it using SVG/Canvas.
SVGScalable Vector Graphics(SVG) is an XML markup language for describing two-dimensional vector graphics. It doesn't loose any quality if they are zoomed or re-sized.
This is a sample code to draw a circle using SVG
<circle cx="350" cy="90" r="50" fill="blue" />
<line x1="100" y1="50" x2="350" y2="90" style="stroke:rgb(50,250,0); stroke-width:2" />
<canvas> is an HTML element which can be used to draw graphics via scripting (usually JavaScript). For example, it can be used to draw graphs, make photo compositions, create animations or even do real-time video processing.
This is a sample code to draw a circle using Canvas:
var canvas = document.getElementById("myCanvas");
var context = canvas.getContext("2d");
context.beginPath();
context.arc(50, 50, 20, 0, 2 * Math.PI, false); //First 3 parameters are centerX, centerY, radius
context.fillStyle = "#8ED6FF";
context.fill();
context.lineWidth = 1;
context.strokeStyle = "black";
context.stroke();
var canvas = document.getElementById("myCanvas");
var context = canvas.getContext("2d");
context.moveTo(50, 50); //x and y co-ordinates for point1
context.lineTo(100, 100); //x and y co-ordinates for point2
context.stroke();
Force Directed Algorithm
Force directed algorithm are class of algorithms for drawing a graph in an aesthetically pleasing way.
The generally accepted aesthetic criteria are
Distribute vertices evenly in the frame
Minimize edge crossings
Make edge lengths uniform
Reflect inherent symmetry
Conform to the frame
Here, we are using the algorithm proposed by Fruchterman and Reingold, 1991 in the paper "Graph drawing by force-directed placement"
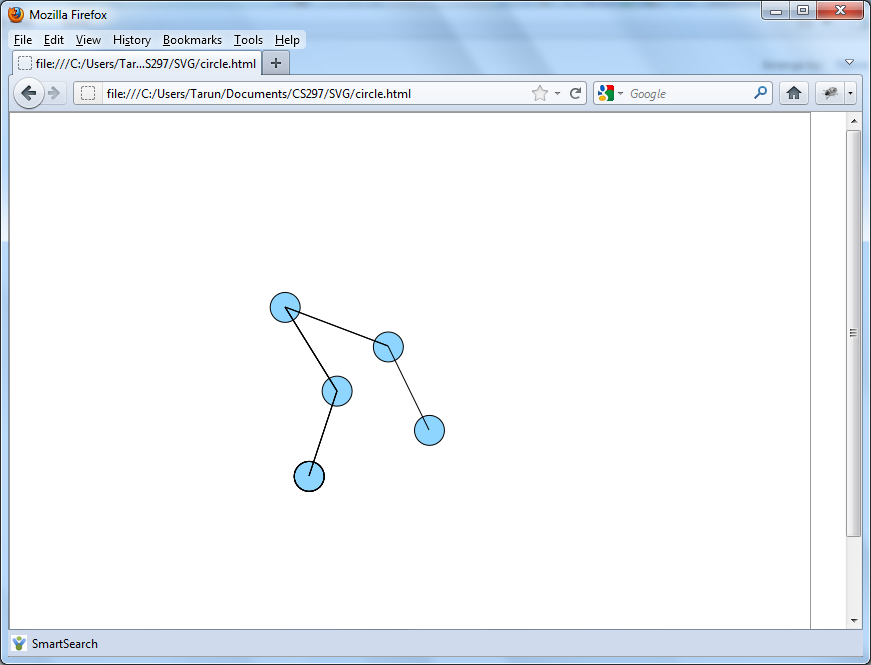
This is the snapshot of the graph on which Force Directed algorithm is used.
The initial points of the graph are randomly selected.
