Chris Pollett > Students > Charles
Print View
[Bio]
[Blog]
[Deliverable #1: Compare Basic Summarizer to Centroid-Based Summarizer using ROUGE]
[Deliverable #2: Create a Dutch Stemmer for the Yioop Search Engine]
[Deliverable #3: Create a New Summarizer for the Yioop Search Engine]
[Deliverable #4: Term Frequency Weighting in the Centroid-Based Summarizer]
[Deliverable #1: Test Yioop Summarizers Against a Large Data Set]
[Deliverable #2: Improve the ROUGE Results for Dr. Pollett's Summarization Algorithm]
[CS 299 End of Fall 2015 Semester Summary]
[Deliverable #3: A Numerically Stable Lanczos Text Summarization Algorithm]
[Deliverable #4: Improving Text Summarization using Automatic Sentence Compression]
Create a New Summarizer for the Yioop Search Engine
Aim
The goal of this deliverable is to find a paper that covers an algorithm used for summarization. Once I have found the right paper, the algorithm will be implemented in PHP and integrated into the Yioop search engine.
Overview
To reiterate from my CS297 proposal, text summarization is the ability to obtain the key ideas from a text passage using as little words as possible. Here I will cover the new algorithm chosen, its results, the work that went into implementing it and the work getting it into the Yioop search engine.
Work Performed
As stated in the aim, my first objective was to find a good summarizer to implement. I felt it had to be something completely different compared to the existing summarizers in the Yioop search engine. The existing summarizers are covered in Deliverable 1. I came across a worthy algorithm known as Luhn's algorithm. Dr. Pollett did not feel the same way, so I searched further. I eventually stumbled upon a graph based algorithm that looked promising. This time my summarizer suggestion passed Dr. Pollett's evaluation and I proceeded to dig into it.
Furthermore, in order to prove I understood the algorithm, Dr. Pollett had me create a short PowerPoint presentation summarizing the algorithm. Once the presentation was complete, Dr. Pollett and I discussed the presentation thoroughly. After the discussion, we both felt we had a good handle on the algorithm and what it would take to implement it. For our own sake we also calculated the order in which the algorithm ran. "The algorithm is O(n2) not counting the outer while loop / for loop" (Dr. Pollett). Now for the details on the Graph Based Ranking Summarizer I implemented. I will first describe the algorithm as it is stated in the paper Multi-Document Summarization Using Graph-Based Iterative Ranking Algorithms and Information Theoretical Distortion Measures to give more detail than what is in the 8 slide presentation. Next I will detail the changes made in our implementation and what I had to do to add the algorithm to the Yioop search engine plus I will showcase the ROUGE results of the new summarizer.
The Graph Based Ranking Summarizer uses and extraction based model. It constructs a weighted graph out of the text where the sentences are the nodes. So how does it work you ask? First the file has to be read entirely into memory. Next the non-ASCII characters are removed. This is because non-ASCII characters can make summarizing more difficult since it would need stemmers for many different languages. This lends me to believe the algorithm is only to target English or English-like languages. The next module replaces all new lines with spaces to help when it is time to split up the text into sentences.
Next the sentences are separated using the following regular expression; (?<!\w\.\w.)(?<![A-Z][a-z]\.)(?<=\.|\?). You should take note that it does not handle the exclamation point. After the sentences are split, they remove the stop words. "Such words are usually not relevant to the semantics of the sentences" (Samei2014). Furthermore, the punctuation is removed from the sentences. Now a porter stemmer is used to stem the remaining words. Stemmers were also covered in a previous deliverable; Deliverable 2. The last trivial part is the frequency computation. A vector is created that holds each word and the count of how many times the word occurs in the text.
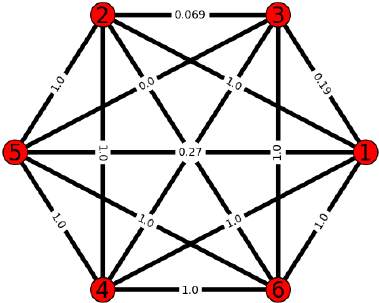
Moreover, the next phases are the most important. This is where the algorithm creates the weighted graph called the adjacency matrix. The calculation to generate the values is known as the distortion measure (DM). In short, each value or DM is the sum of the frequencies of all the words in common divided by the sum of words that are not in common. Here is the algorithm as stated in (Semei2014) below along with the an image of what the graph may look like:
|
|
Those four steps may sound confusing and they are. The last step after computing the adjacency matrix is to extract the summaries. This is done by leveraging the page rank algorithm created by Larry Page and Sergey Brin, the founders of Google. It was intended to be sued for ranking web pages but it appears to have use here too. Basically it computes an initial vector of equal probabilities. For example, if there are 5 sentences, the initial vector would have 5 items all set to 1/5. The adjacency matrix is multiplied by the probability vector to generate a new probability vector. Then the squared difference of the old probability vector and the new probability vector are compared. The process is repeated until the squared difference is below some threshold. This algorithm deviates from the original page rank algorithm. It does not use the squared difference method. They only iterate 10 times. "As few as 10 iterations produced a good approximate ordering, competitive with the exact ordering produced by the traditional convergence measure" (Langville2006). When the 10 iterations are complete, the probability vector is returned and is used to generate the summary. Each sentences is added to the summary in order of highest probability to lowest probability until the allowed summary length has been reached.
As I did in Deliverable 1, they also used ROUGE to evaluate how well or how not so well their summarizer performs. The ROUGE-N test was used with N set to 1. Two tests were ran against the Document Understanding Conference (DUC) 2002 data set. The DUC 2002 data set contains "organized yearly evaluation of document summarization" (Samei). The first test had the summarizer's settings to their maximum values. The resulting value was 0.3224. The second test was run with the settings set to average settings. The result was 0.3547. The top 6 benchmark values in ROUGE range from 0.2992 - 0.3588. If the results are accurate as claimed in the paper, the Graph Based Ranking summarizer is one that should be evaluated when choosing a summarization algorithm.
A tremendous amount of information was just covered. I hope you are still with me. We saw that the algorithm has a lot of moving parts which is what made it was fun to dissect. Now let us talk about our implementation. The first thing we changed was filtering non-ASCII characters. Dr. Pollett and I felt, since the Yioop search engine has many locales (with stemmers and stop word removers including ones like Dutch that include non-ASCII characters), we can support them. The other deviation is how we chose to weigh the sentences. It was unclear how the sentences were weighted so we decided to normalize the frequency values and not weight them further.
Once the code was written for the Graph Based Ranking summarizer (GBS), it had to be integrated into the Yioop search engine. Thanks to a tip by Dr. Pollett of how to search the code base, I was able to find all of the places I needed to inject code to get the summarizer integrated. First I ran "php code_tool.php search .. centroid" from the Yioop repository bin directory. It found all of the places the word centroid was located in the code base that may or may not have applied to my objective. As I took a look at each line, I either added the appropriate code or left it alone. I ended up modifying fetcher.php, crawl_component.php, crawl_constants.php, graph_based_summarizer.php, phrase_parser.php, html_processor.php, page_processor.php, text_processor.php and the English locale configure.ini file. When I tried my new summarizer for the first time I had errors all over the screen. I started adding echo lines throughout the code, spending hours tweaking the code until the errors were gone. In order to find some of the hidden hooks, I walked the stack trace backwards. There were some places that could not be found by text searches because they were loaded dynamically. Once I was confident the code was ready, I submitted an issue and a patch to the Mantis BT repository manager (Dr. Pollett) for review. Hopefully this summarizer will make it into the Yioop search engine also.
Results
In conclusion the Graph Based Summarizer work was some of the most interesting work I have done in a while. The results I got were just below the results stated in the paper. However the results were dramatically lower than the BS and CBS already in the Yioop search engine. It is probably because of the way we chose to weight each sentence. The highest result here is not anywhere near the lowest on either of the other summarizers. For example, in the ROUGE-1 test the CBS 95%-conf int value was 0.76663, the BS value was 0.80587, and the GBS value was 0.32603. It seems that there is more work to do here.
- configure.ini
- crawl_component.php
- crawl_constants.php
- fetcher.php
- graph_based_summarizer.php
- html_processor.php
- page_processor.php
- phrase_parser.php
- text_processor.php
| Graph Based ROUGE Result |
|---|
|
--------------------------------------------- 11 ROUGE-1 Average_R: 0.32603 (95%-conf.int. 0.16429 - 0.49286) 11 ROUGE-1 Average_P: 0.30169 (95%-conf.int. 0.15000 - 0.45119) 11 ROUGE-1 Average_F: 0.31165 (95%-conf.int. 0.15619 - 0.46519) --------------------------------------------- 11 ROUGE-2 Average_R: 0.19028 (95%-conf.int. 0.04000 - 0.35667) 11 ROUGE-2 Average_P: 0.18023 (95%-conf.int. 0.04000 - 0.34667) 11 ROUGE-2 Average_F: 0.18470 (95%-conf.int. 0.04000 - 0.35111) --------------------------------------------- 11 ROUGE-3 Average_R: 0.12849 (95%-conf.int. 0.02500 - 0.24500) 11 ROUGE-3 Average_P: 0.12012 (95%-conf.int. 0.02500 - 0.24000) 11 ROUGE-3 Average_F: 0.12370 (95%-conf.int. 0.02500 - 0.24000) --------------------------------------------- 11 ROUGE-4 Average_R: 0.00000 (95%-conf.int. 0.00000 - 0.00000) 11 ROUGE-4 Average_P: 0.00000 (95%-conf.int. 0.00000 - 0.00000) 11 ROUGE-4 Average_F: 0.00000 (95%-conf.int. 0.00000 - 0.00000) --------------------------------------------- 11 ROUGE-L Average_R: 0.20862 (95%-conf.int. 0.08138 - 0.36597) 11 ROUGE-L Average_P: 0.28501 (95%-conf.int. 0.14167 - 0.44405) 11 ROUGE-L Average_F: 0.23625 (95%-conf.int. 0.10295 - 0.39301) --------------------------------------------- 11 ROUGE-W-1.2 Average_R: 0.14754 (95%-conf.int. 0.05208 - 0.27167) 11 ROUGE-W-1.2 Average_P: 0.26469 (95%-conf.int. 0.11303 - 0.43571) 11 ROUGE-W-1.2 Average_F: 0.18541 (95%-conf.int. 0.07116 - 0.33047) --------------------------------------------- 11 ROUGE-S* Average_R: 0.13775 (95%-conf.int. 0.05000 - 0.24191) 11 ROUGE-S* Average_P: 0.11769 (95%-conf.int. 0.04000 - 0.22095) 11 ROUGE-S* Average_F: 0.12457 (95%-conf.int. 0.04019 - 0.22895) --------------------------------------------- 11 ROUGE-SU* Average_R: 0.19791 (95%-conf.int. 0.07333 - 0.33667) 11 ROUGE-SU* Average_P: 0.17406 (95%-conf.int. 0.06500 - 0.31556) 11 ROUGE-SU* Average_F: 0.18243 (95%-conf.int. 0.06702 - 0.32222) |
| GBS ROUGE Configuration File |
|---|
|
<ROUGE-EVAL version="1.0"> <EVAL ID="1"> <PEER-ROOT> ./Yioop-testGraphBased/systemsAreGenerated </PEER-ROOT> <MODEL-ROOT> ./Yioop-testGraphBased/modelsAreHuman </MODEL-ROOT> <INPUT-FORMAT TYPE="SEE"> </INPUT-FORMAT> <PEERS> <P ID="11"> AgiletaskslistswhatdoesdonemeaninAgileCS200WBlog.html</P> </PEERS> <MODELS> <M ID="A"> AgiletaskslistswhatdoesdonemeaninAgilCS200WBlog.html</M> </MODELS> </EVAL> <EVAL ID="2"> <PEER-ROOT> ./Yioop-testGraphBased/systemsAreGenerated </PEER-ROOT> <MODEL-ROOT> ./Yioop-testGraphBased/modelsAreHuman </MODEL-ROOT> <INPUT-FORMAT TYPE="SEE"> </INPUT-FORMAT> <PEERS> <P ID="11"> DeliveringaprojectandpresentingtoamultilevelaudienceCS200WBlog.html</P> </PEERS> <MODELS> <M ID="A"> DeliveringaprojectandpresentingtoamultilevelaudienceCS200WBlog.html</M> </MODELS> </EVAL> <EVAL ID="3"> <PEER-ROOT> ./Yioop-testGraphBased/systemsAreGenerated </PEER-ROOT> <MODEL-ROOT> ./Yioop-testGraphBased/modelsAreHuman </MODEL-ROOT> <INPUT-FORMAT TYPE="SEE"> </INPUT-FORMAT> <PEERS> <P ID="11"> HandingoffaprojecttoaclientwhataretherisksandchallengesCS20.html</P> </PEERS> <MODELS> <M ID="A"> HandingoffaprojecttoaclientwhataretherisksandchallengesCS20.html</M> </MODELS> </EVAL> <EVAL ID="4"> <PEER-ROOT> ./Yioop-testGraphBased/systemsAreGenerated </PEER-ROOT> <MODEL-ROOT> ./Yioop-testGraphBased/modelsAreHuman </MODEL-ROOT> <INPUT-FORMAT TYPE="SEE"> </INPUT-FORMAT> <PEERS> <P ID="11"> LinkedInprofileshowtousethemhowtomarketyourselfhowtonetwork.html</P> </PEERS> <MODELS> <M ID="A"> LinkedInprofileshowtousethemhowtomarketyourselfhowtonetwork.html</M> </MODELS> </EVAL> <EVAL ID="5"> <PEER-ROOT> ./Yioop-testGraphBased/systemsAreGenerated </PEER-ROOT> <MODEL-ROOT> ./Yioop-testGraphBased/modelsAreHuman </MODEL-ROOT> <INPUT-FORMAT TYPE="SEE"> </INPUT-FORMAT> <PEERS> <P ID="11"> SocialMediaandBrandingCS200WBlog.html</P> </PEERS> <MODELS> <M ID="A"> SocialMediaandBrandingCS200WBlog.html</M> </MODELS> </EVAL> <EVAL ID="6"> <PEER-ROOT> ./Yioop-testGraphBased/systemsAreGenerated </PEER-ROOT> <MODEL-ROOT> ./Yioop-testGraphBased/modelsAreHuman </MODEL-ROOT> <INPUT-FORMAT TYPE="SEE"> </INPUT-FORMAT> <PEERS> <P ID="11"> TheAgileTeamandwhatisaBacklogWhataretheyforandwhyaretheyimp.html</P> </PEERS> <MODELS> <M ID="A"> TheAgileTeamandwhatisaBacklogWhataretheyforandwhyaretheyimp.html</M> </MODELS> </EVAL> <EVAL ID="7"> <PEER-ROOT> ./Yioop-testGraphBased/systemsAreGenerated </PEER-ROOT> <MODEL-ROOT> ./Yioop-testGraphBased/modelsAreHuman </MODEL-ROOT> <INPUT-FORMAT TYPE="SEE"> </INPUT-FORMAT> <PEERS> <P ID="11"> WhatfivetechnicalskillsareemployersseekingWhatfivesoftskillsput.html</P> </PEERS> <MODELS> <M ID="A"> WhatfivetechnicalskillsareemployersseekingWhatfivesoftskillsput.html</M> </MODELS> </EVAL> <EVAL ID="8"> <PEER-ROOT> ./Yioop-testGraphBased/systemsAreGenerated </PEER-ROOT> <MODEL-ROOT> ./Yioop-testGraphBased/modelsAreHuman </MODEL-ROOT> <INPUT-FORMAT TYPE="SEE"> </INPUT-FORMAT> <PEERS> <P ID="11"> WhatisAgileandwhatareuserstoriesCS200WBlog.html</P> </PEERS> <MODELS> <M ID="A"> WhatisAgileandwhatareuserstoriesCS200WBlog.html</M> </MODELS> </EVAL> <EVAL ID="9"> <PEER-ROOT> ./Yioop-testGraphBased/systemsAreGenerated </PEER-ROOT> <MODEL-ROOT> ./Yioop-testGraphBased/modelsAreHuman </MODEL-ROOT> <INPUT-FORMAT TYPE="SEE"> </INPUT-FORMAT> <PEERS> <P ID="11"> WhatisanAgileSprintRetrospectiveAbusylifeofagirlgamer.html</P> </PEERS> <MODELS> <M ID="A"> WhatisanAgileSprintRetrospectiveAbusylifeofagirlgamer.html</M> </MODELS> </EVAL> <EVAL ID="10"> <PEER-ROOT> ./Yioop-testGraphBased/systemsAreGenerated </PEER-ROOT> <MODEL-ROOT> ./Yioop-testGraphBased/modelsAreHuman </MODEL-ROOT> <INPUT-FORMAT TYPE="SEE"> </INPUT-FORMAT> <PEERS> <P ID="11"> WhatisanAgileSprintRetrospectiveCS200WBlog.html</P> </PEERS> <MODELS> <M ID="A"> WhatisanAgileSprintRetrospectiveCS200WBlog.html</M> </MODELS> </EVAL> </ROUGE-EVAL> |
| Human Generated Input | System Generated Input |
|---|---|
|
<html> <head> <title>AgiletaskslistswhatdoesdonemeaninAgilCS200WBlog</title> </head> <body bgcolor="white"> <a name="1">[1]</a> <a href="#1" id=1>Agile tasks lists, what does done </a> <a name="2">[2]</a> <a href="#2" id=2>In life just as at work, you may have had someone ask you the dreaded question Are you done yet?</a> <a name="3">[3]</a> <a href="#3" id=3>That is why to ensure transparency and improve quality in an agile environment, the definition of done (DoD) must be clearly defined and have a consensus among the team.</a> <a name="4">[4]</a> <a href="#4" id=4>We will walk through what the DoD is, an example of how to create a DoD and what value it brings to the sprint cycle.</a> <a name="5">[5]</a> <a href="#5" id=5>According to the Agile Alliance and Institute (2014) the DoD is a list of criteria which must be met before a product increment often a user story is considered done. </a> <a name="6">[6]</a> <a href="#6" id=6>The most important feature of the DoD is it keeps hidden work or scope creep from happening.</a> <a name="7">[7]</a> <a href="#7" id=7>The DoD gets iteratively worked just like the user stories within each sprint. According to Scrum.org (2013), the Definition of Done is not changed during a Sprint, but should change periodically between Sprints to reflect improvements the Development Team has made in its processes and capabilities to deliver software.</a> <a name="8">[8]</a> <a href="#8" id=8>Moreover, you will find the risk is reduced, teams are more focused, and communication between the client is better.</a> <a name="9">[9]</a> <a href="#9" id=9>By making the DoD a way of life and committing to exceptional work, the client will be able to visualize what complete really is. </a> </body> </html> |
<html> <head> <title>AgiletaskslistswhatdoesdonemeaninAgileCS200WBlog</title> </head> <body bgcolor="white"> <a name="1">[1]</a> <a href="#1" id=1>Agile tasks lists, what does done mean in Agile?</a> <a name="2">[2]</a> <a href="#2" id=2>To make sure the sprints are prosperous, the exercise of creating the DoD must take place stated previously.</a> <a name="3">[3]</a> <a href="#3" id=3>First let's get the definition of done out of the way.</a> <a name="4">[4]</a> <a href="#4" id=4>The only difference is the DoD gets worked outside of sprints only.</a> <a name="5">[5]</a> <a href="#5" id=5>org/guide/definition-of-done.</a> <a name="6">[6]</a> <a href="#6" id=6>We will walk through what the DoD is, an example of how to create a DoD and what value it brings to the sprint cycle.</a> <a name="7">[7]</a> <a href="#7" id=7>The DoD gets iteratively worked just like the user stories within each sprint.</a> <a name="8">[8]</a> <a href="#8" id=8>Retrieved from Definition of Done: https://www.</a> <a name="9">[9]</a> <a href="#9" id=9>Guide to Agile Practices.</a> <a name="10">[10]</a> <a href="#10" id=10>However, you develop your DoD, there should be acceptance criteria from the client in there somewhere.</a> <a name="11">[11]</a> <a href="#11" id=11>In an agile work environment you are most likely not the only one involved in making that decision.</a> <a name="12">[12]</a> <a href="#12" id=12>In addition, the DoD is critical to having successful sprints.</a> <a name="13">[13]</a> <a href="#13" id=13>By making the DoD a way of life and committing to exceptional work, the client will be able to visualize what complete really is.</a> <a name="14">[14]</a> <a href="#14" id=14>In conclusion, a good DoD will change the "Are you done yet?</a> <a name="15">[15]</a> <a href="#15" id=15>The most important feature of the DoD is it keeps hidden work or scope creep from happening.</a> <a name="16">[16]</a> <a href="#16" id=16>In other words, it is the acceptance criteria the work must pass to be evaluated as complete.</a> <a name="17">[17]</a> <a href="#17" id=17>According to the Agile Alliance and Institute 2014 the DoD is a list of criteria which must be met before a product increment often a user story is considered done.</a> <a name="18">[18]</a> <a href="#18" id=18>According to Scrum.</a> <a name="19">[19]</a> <a href="#19" id=19>scrum.</a> <a name="20">[20]</a> <a href="#20" id=20>A.</a> <a name="21">[21]</a> <a href="#21" id=21>org.</a> <a name="22">[22]</a> <a href="#22" id=22>This will decrease guess work and ambiguity.</a> <a name="23">[23]</a> <a href="#23" id=23>"In life outside of work, we can consult our own minds to make the determination if something is done or not.</a> <a name="24">[24]</a> <a href="#24" id=24>That is why to ensure transparency and improve quality in an agile environment, the definition of done DoD must be clearly defined and have a consensus among the team.</a> <a name="25">[25]</a> <a href="#25" id=25>Retrieved from Definition Of Done: http://guide.</a> <a name="26">[26]</a> <a href="#26" id=26>Click here to view the Criterion Report.</a> <a name="26">[27]</a> <a href="#27" id=26>References.</a> <a name="26">[28]</a> <a href="#28" id=26>Agile, A.</a> <a name="26">[29]</a> <a href="#29" id=26>png.</a> <a name="26">[30]</a> <a href="#30" id=26>Definition of Done Image.</a> <a name="26">[31]</a> <a href="#31" id=26>https://www.</a> <a name="26">[32]</a> <a href="#32" id=26>html.</a> <a name="26">[33]</a> <a href="#33" id=26>Scrum.</a> <a name="26">[34]</a> <a href="#34" id=26>For example, the categories could be story completed or iteration completed.</a> </body> </html> |
References
[Samei2014] Multi-Document Summarization Using Graph-Based Iterative Ranking Algorithms and Information Theoretical Distortion Measures. Borhan Samei, Marzieh Eshtiagh, Fazel Keshtkar and Sattar Hashemi, The Florida AI Research Society. 2014.
[Agrawal2014] A Graph Based Ranking Strategy for Automated Text Summarization. Nitin Agrawal, Shikhar Sharma, Prashant Sinha, Shobha Bagai, DU Journal of Undergraduate Research and Innovation. 2014.
[Langvielle2006] Google's PageRank and Beyond: The Science of Search Engine Rankings. Amy Langville and Carl Meyer.Princeton University Press.2006.