Debugging
The main argument for using an IDE like Eclipse is the debugger.
The main features of a debugger are:
setting breakpoints
inspecting variables
stepping through code
In Eclipse we set a breakpoint be right clicking in the margin to the left of some suspicious line of code.
Set a breakpoint at the first pop in StackMachine.add.
Now run StackMachineCUI by selecting:
Run>Debug
You will be prompted to open the debugger perspective. Agree to this. Note that the Java perspective can be returned by selecting the Java tab in the upper left corner.
Push a few numbers on the stack, then type "add".
Here's the perspective:
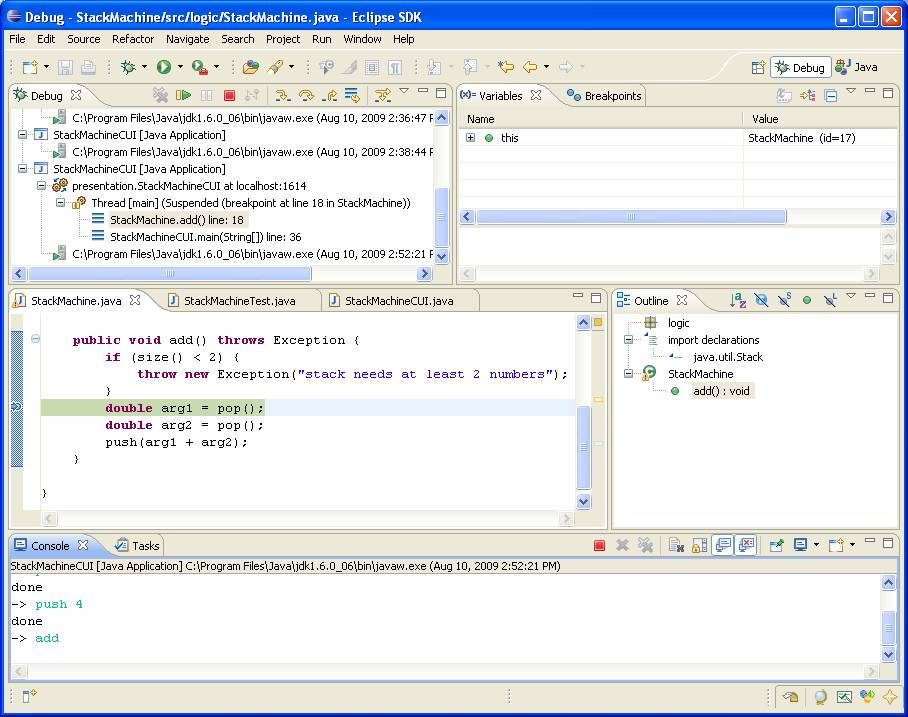
There are two ways to step through a program: step into and step over. Stepping into a method invocation takes us to the first line of that method. Stepping over it takes us to the next line of the current program after the function call.
Step over the two calls to pop (by pressing F6). Here's the debug perspective:
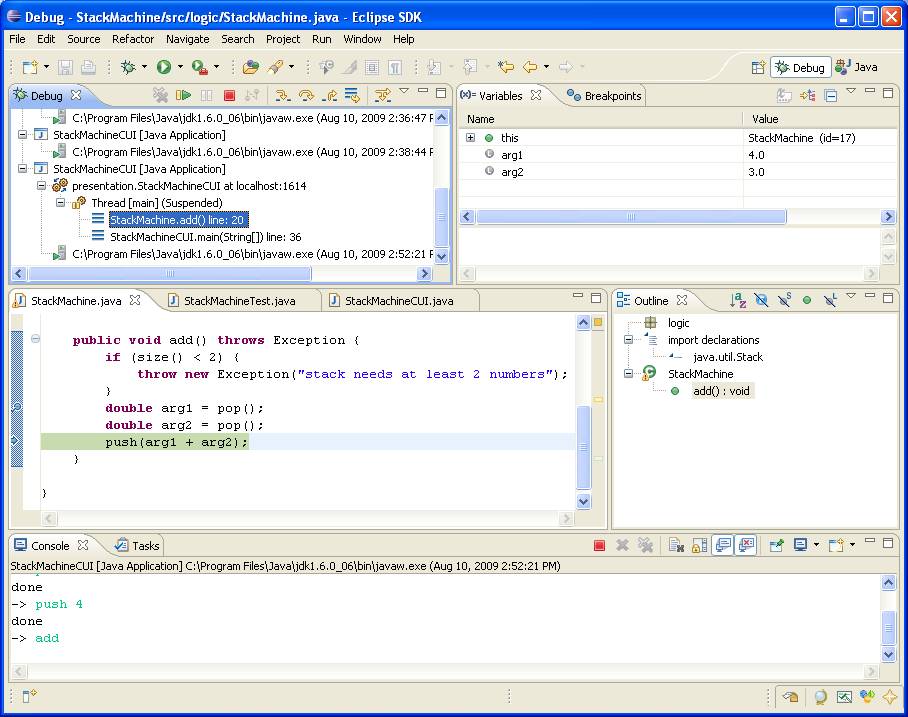
Note that in the Variables view we can see the current values of arg1 and arg2.
Select Resume (F8) to run to the next breakpoint.