Hammond's
Corruption Model
In 1999 Ross Hammond devised a simple CA model to study the effects of public policy on the spread of corruption. The model is discussed in an article written by Jonathan Rauch for Atlantic Magazine.
In
0 = honest (black)
1 = corrupt (white)
2 = jailed (gray)
The ambience of a cell is the number of jailed neighbors. This is set during the observation phase.
In addition to state and ambience, a cell has two additional attributes:
when-jailed = time of last incarceration
complaints = the number of complaints made against this citizen
We add a new phase to the observation-update loop called the interaction phase:
ask patches [observe]
ask patches [interact]
ask patches [update]
During the interaction phase a citizen selects a random un-jailed neighbor to conduct some business. If the citizen is honest but the neighbor is corrupt, then the neighbor cheats the citizen and the citizen files a complaint against the neighbor. Similarly, if the citizen is corrupt but the neighbor is honest, then the neighbor files a complaint against the citizen.
During the update phase a jailed citizen is set free if he has completed his sentence. We optimistically assume the citizen is at least temporarily rehabilitated and becomes honest.
An honest citizen figures crime pays and goes bad if the ambience (i.e., the number of jailed neighbors) is below the go-bad threshold.
A corrupt citizen goes to jail if the number of complaints lodged against him exceeds the maximum complaints threshold. Otherwise, a corrupt citizen figures crime doesn't pay and goes straight if the number of jailed neighbors is above the go-straight threshold.
We can express these state changes using a state diagram:
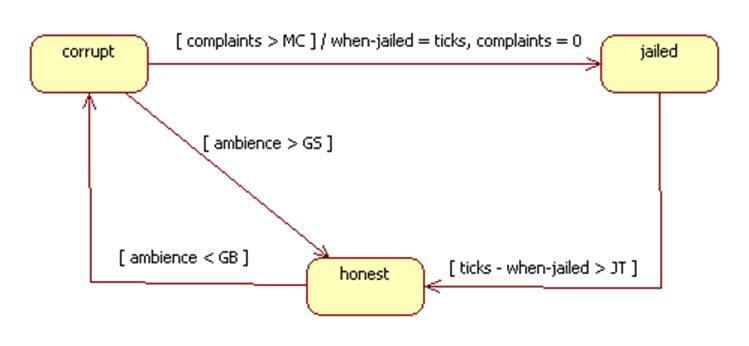
Where:
GB = go-bad threshold
GS = go-straight threshold
JT = jail time
MC = maximum complaints
Here's a screen shot of the corruption model:
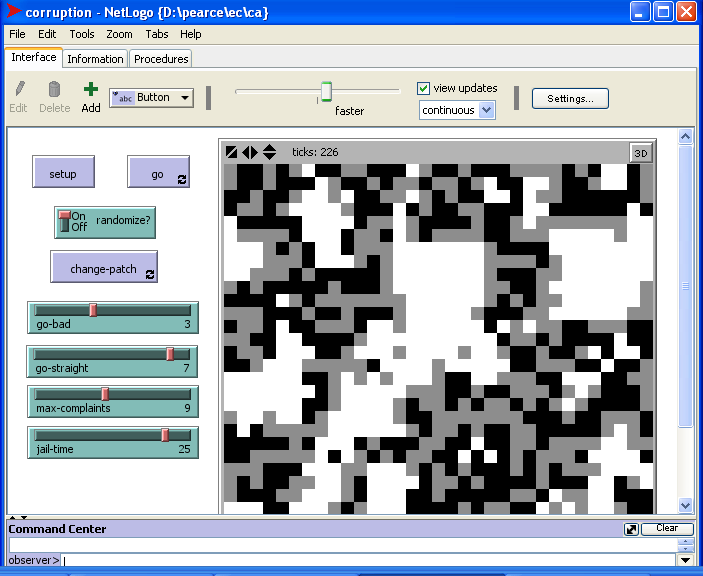
Note that the model provides four sliders that allow the user to dynamically adjust the go-bad, go-straight, max-complaints, and jail-time thresholds. In theory, this would allow a public policy analyst to experiment with modifications of tolerance (max-complaints) and vindictiveness (jail time). The go-bad and go-straight controls adjust the fearfulness of the population.
The view window shows the society after 226 ticks. Great white patches indicate major crime sprees. Gray patches indicate the current prison population. Black patches represent the honest citizens.
Extending the Model
We can improve the model by giving each patch an influence attribute. For most patches the value of this attribute is 1, but for some the value can be higher. When an unjailed patch updates its state, it computes three ratios: honest-neighbors, corrupt-neighbors, and jailed-neighbors. Influential neighbors have greater weight in the computation of each of these ratios. The new state of p is based on some sensible combination of these ratios. For example, if most of p's neighbors are corrupt, and if few are in jail, then p becomes corrupt. If most are honest and if many are in jail, the p becomes honest. etc. We this in place we can study the policy of targeting influential individuals.