Emergent Behavior
Even though the behavior of individual agents in a society is simple (eg. based on local knowledge, do what your neighbors are doing, etc.) the behavior of the society as a whole can be complex.
Example: Mosaics
We can think of a mosaic as a population of monochromatic
tiles (the agents). Only when we step back far enough from the mosaic do we see
the macro-state: a photo of the
Example: Science
Physics studies the properties (mass momentum, spin, etc.) of subatomic particles. A complete description of the microstate/behavior of the world would include the state of every particle.
While the behavior of sub-atomic particles is simple, the behavior of the visible world is very complex.
While the behavior of cells is simple, the behavior of the body is complex. For example, neurons are simple, but brains do complex things like writing programs. Also, the cells in an embryo do simple things, but the embryo develops into a human.
Example: The Law of Large Numbers (LLN)
Assume every agent in a population of N agents is assigned a random value between 1 and 6. Let VN be the average of these values. The Law of large Numbers states that as N increases, VN will approach the expected value:
(1 + 2 + 3 + 4 + 5 + 6)/6 = 21/6 = 3.5
We can demonstrate this with a simple NetLogo program. Each time the "update 100x" button is pressed, 100 random numbers are added to a list. The value of VN is plotted against the value of N. Here's the graph as N approaches 121:
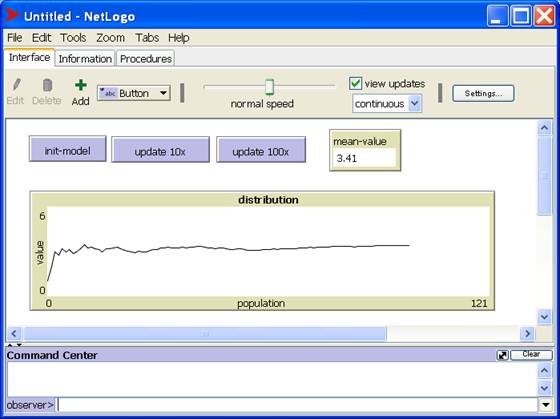
Note that VN varies wildly for small values of N, but as N gets larger, the graph begins to level out.
As N approaches 900, we see that VN gets very close to 3.5:

The Law of Large Numbers is a simple yet pervasive example of emergence. No agent actually has the value 3.5, yet as more agents are added to the population, their values begin to cancel each other out, so VN, the macro-state, begins to converge to 3.5.
More Examples
Computers
Brains
Example: Power Laws
Consider the formula:
freq(x) = # of agents with state = x
We can consider the graph (or histogram) of freq(x) to be a snapshot of the macro-state of some system.
For example, we would expect freq(x) to be almost constant in a population in which states are randomly distributed. In other words, there should be N agents in state 1, N in state 2, etc.
We would expect the graph of freq(x) to be a bell curve if states were distributed using random-normal.
In some important natural cases freq(x) has the general form:
freq(x) = a * x-k
This is called the power law or inverse exponential.
In this case the graph has the form:

Zipf's Law
We can think of the words in a document as agents. If we order the words in a concordance according to frequency, then according to Zipf's Law, the frequency of the word in position k will be approximately:
freq(k) = k-1
Pareto's Law
Pareto's Law, also called the 80-20 law, says 80% of the effects come from 20% of the causes.
For example, 80% of the sales come from 20% of the customers, 80% of the work is done by 20% of the people, 80% of the crimes are committed by 20% of the criminals, 80% of the wealth belongs to 20% of the people, etc.
The Pareto Distribution is a power law. For example, let the state of an agent be his wealth, then
freq(x) = # of agents with wealth > x
is approximated by the power law:
freq(x) = x-k
More Examples
Here are some other examples from nature that follow the power law distribution:
magnitudes of earthquakes
city sizes
file sizes
sizes of forest fires
sizes of oil fields
etc.
Example: Tipping Points, Phase Transitions, Self-Organized Criticality (SOC)
A phase is a set of similar macro-states.
Example: solid, liquid, and gas are the phases of matter.
Example: sitting and standing are the phases of an audience.
In a complex system SOC occurs when micro-behavior naturally leads to a macro-state that is critical in the sense that something that happens at the micro-level can cause a phase transition.
Adding grains of sand to a sand pile is an example. As the sand pile reaches a certain angle of repose, adding another grain can cause an avalanche. Furthermore, an avalanche can cause avalanches in neighboring piles. This can lead to a cascade of avalanches. If we graph the number of grains displaced, we get a power law distribution:
freq(x) = frequency of an avalanche in which x grains of sand are displaced = x-k
The phenomenon was first applied to sociology when sociologists noticed white flight from neighborhoods when the number of non-white families reached a critical number.