To isolate regions on the graph where the mouse hovers the most
Description:The idea of the task was to separate the regions on the screen where the mouse hovers the most.For finding this we first had to clean the data we got from Deliverable 2. We did various experiments to clean the data. Finally, we decided to plot only those points around which there is more concentration of the points e.g., consider and plot only those points around which there are more than 10 points within 10 pixel range.
The next task after cleaning the data was to separate the dense regions. The screen coordinates, where the mouse moved, had to be divided into small dense regions and enclosed by a bounded figure. This was done to form small-enclosed figures, which would serve the purpose of transition states. We used gift wrapping algorithm for this purpose. The idea was to draw a convex hull around any dense region. The algorithm first computes the point, min, of minimal horizontal value and all the points, which are within 30-pixel range of that point. All these points were stored in a vector. Within this vector, we find the point, max, of maximal horizontal value. Using a vertical line and starting at min, we calculated the clockwise angle to every point in the vector until one gets max. We selected the point with which it forms the smallest clockwise angle. This point is added to the convex polygon. Similarly using a vertical line and starting at max, we calculated the next point of minimal clockwise angle greater than 180 until one gets to min. These points are also added to the polygon. From this point, we selected another point, which formed the greatest angle in clockwise direction. These points were added to the polygon. These points form the convex polygon around each dense region. We deleted all these points from the actual list and continued with the gift-wrapping algorithm, until all regions were surrounded by a convex polygon.
Example:This is what my graph looks like after cleaning the data points.
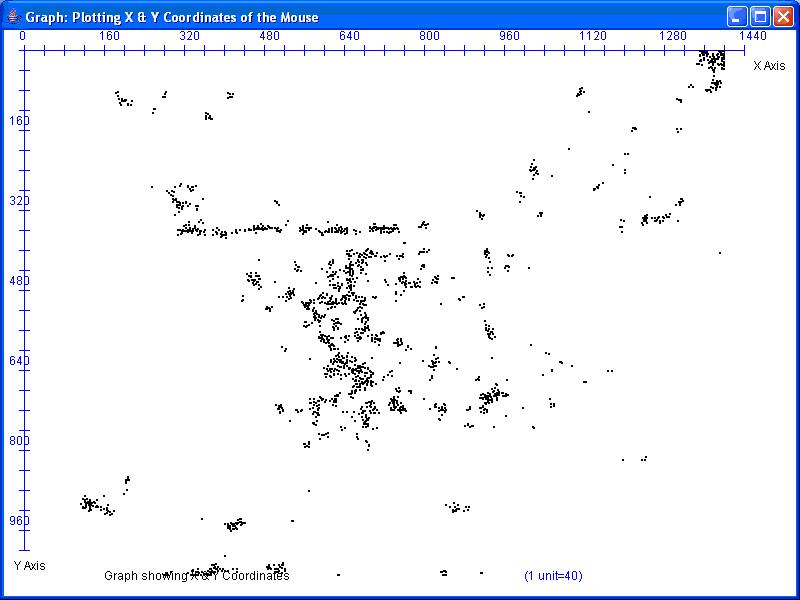
The above figure is the result of cleaning up the data by selecting only those points around which there are more than 10 points within 10 pixel range
Example:This is what my graph looks like when we draw convex polygon around the dense regions.
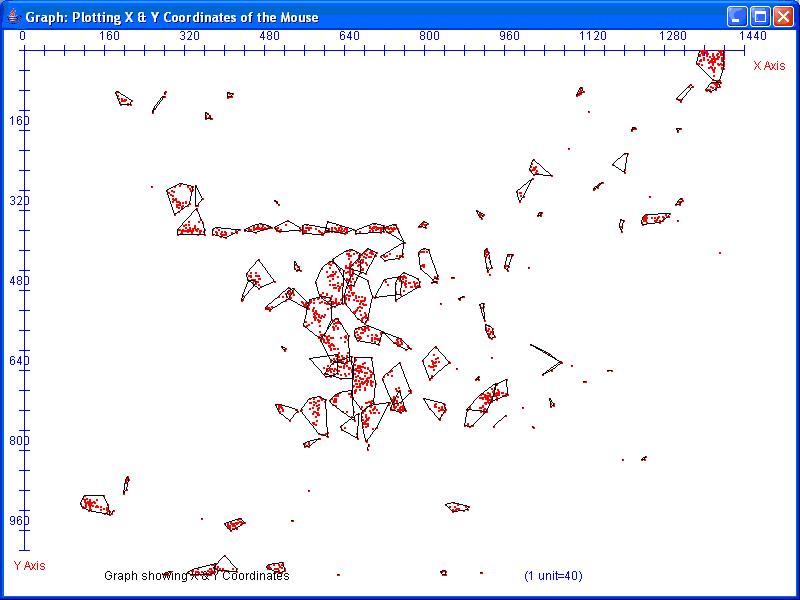
The above figure is the result of selecting a point and all the points which are within 30 pixel range of that point and also all points which are in 30 pixel range of the first set of points. This gave us a bit wider set of dense regions in one polygon.
//  To plot the X & Y coordinates of the dense regions covered by mouse
// considering adjoining points to the first set of points
// Author: Shivani Hashia
// Created: 5/3/04


import java.util.*;
import java.io.*;
import java.util.StringTokenizer;
import java.awt.*;
import java.awt.event.*;
import javax.swing.*;


// This class reads the input file which has the coordinates
// Stores the coordinates in vectors and passes them to the PlotCoord class

public class FindDense3 {
  public static void main(String args[])
  {
    Vector vecX = new Vector();
    Vector vecY = new Vector();
    Vector vecT = new Vector();
    Vector vecR = new Vector();
   try{
      FileInputStream fis =
         new FileInputStream("C:/cprog/Xslt/Project/temp/trymouseapp/tmp.txt");
      BufferedReader br = new BufferedReader(new InputStreamReader(fis));
      String tempLine;

      while ((tempLine = br.readLine()) != null) {

         StringTokenizer t=new StringTokenizer(tempLine);
          XCoor = Integer.parseInt(t.nextToken());
          vecX.add(new Integer(XCoor));
          YCoor = Integer.parseInt(t.nextToken());
          vecY.add(new Integer(YCoor));
          TempTime = Integer.parseInt(t.nextToken());
          vecT.add(new Double(TempTime));
          TempSize = Integer.parseInt(t.nextToken());
          vecR.add(new Integer(TempSize));
         }

      Part5 plotcoord = new Part5(vecX,vecY,vecT);

       if (graph.isVisible()) graph.setVisible(false);
      else graph.show();


         }

   catch (IOException e)
   {
      System.out.println("Error" +e);
      System.exit(1);
   }


  }
   private static int XCoor,YCoor,TempSize;
   private static double TempTime;
  private static JFrame graph = new GraphFrame();
}


// Class creates the frame for plotting the graph

class GraphFrame extends JFrame
{
 public GraphFrame()
   {  setTitle("Graph: Plotting X & Y Coordinates of the Mouse");
      setSize(800,600);
   setBackground ( Color.white );
      addWindowListener(new WindowAdapter()
      { public void windowClosing(WindowEvent e)
         {System.exit(0);
         }
      } );
      Container contentPane = getContentPane();
      contentPane.add(new Part5());

   }

}


// Class plots the points on the graph

class Part5 extends JPanel{

   public Part5(Vector x,Vector y, Vector t)

   {
      int tempXi,tempYi,tempXj,tempYj,count=0;

      System.out.println("xsize"+x.size());
      for(int i=0;i<x.size();i++)
      {
       tempXi=((Integer)x.elementAt(i)).intValue();
          tempYi=((Integer)y.elementAt(i)).intValue();


      count=0;
         for(int j=1;j<x.size();j++)
         {
          tempXj=((Integer)x.elementAt(j)).intValue();
          tempYj=((Integer)y.elementAt(j)).intValue();
         // System.out.println("tempXj"+tempXj+","+tempYj);
          if((((tempXi-DIST) <=tempXj) && (tempXj<(tempXi+DIST)))
          &&(((tempYi-DIST) <=tempYj)
   && (tempYj<(tempYi+DIST))))
         {count++;

         }
         }

         if(count>=10)
         {
         XCoor.add(new Integer(tempXi));
         YCoor.add(new Integer(tempYi));
         TmpPoint.add(new Point(tempXi,tempYi));
         }
         }

         }


   public Part5()
   {}


public void FindBound(Graphics g)
{

   int [] XPoly= new int[MAX];
   int [] YPoly= new int[MAX];
   int cnt1=0,hullcnt=0;


      hull =new HullPoints();
      while(TmpPoint.size()>2)
         {
            Point curMin = (Point)TmpPoint.elementAt(0);


         curMin = FindMin(curMin);


            hull.addPoint(curMin.x,curMin.y);

            TmpPoint.remove(new Point(curMin));

            Vector morePts= new Vector();

            morePts=FindAdjoiningPoints(curMin);

            Vector newmorePts= new Vector();


            for(int m=0;m<morePts.size();m++)
            {
               Point newtmp= (Point) morePts.elementAt(m);

               newmorePts= FindAdjoiningPoints(newtmp);
            }


            Vector conHull= new Vector();

            conHull=hull.makePolygon();

            hull.clear();


         for(int i=0;i<MAX; i++)
      {

         XPoly[i]= 0;
         YPoly[i]=0;
      }
            for(int i=0;i<conHull.size(); i++)
      {
         Point temp = (Point) conHull.elementAt(i);
         XPoly[i]= temp.x;
         YPoly[i]=temp.y;
         cnt1++;

      }

   DrawEnclosure(g,cnt1,XPoly,YPoly);

      cnt1=0;

         }

}

// Function to find the adjoining points which are within 30 pixel
//range of the point

public Vector FindAdjoiningPoints(Point curMin)
{
   Vector morePts = new Vector();
   for(int j=0;j<TmpPoint.size();j++)
            {

            Point tmp = (Point) TmpPoint.elementAt(j);
             if((((curMin.x-MARGIN) <=tmp.x) &&
             (tmp.x<(curMin.x+MARGIN))) &&
(((curMin.y-MARGIN) <=tmp.y) && (tmp.y<(curMin.y+MARGIN ))))
             {

             hull.addPoint(tmp.x,tmp.y);

              morePts.add(new Point(tmp.x,tmp.y));
               TmpPoint.remove(new Point(tmp));
               // If find all adjoining points
         //    FindAdjoiningPoints(tmp);

             }
            }

   return morePts;
}


//Function to draw a polygon aroung the points

public void DrawEnclosure(Graphics g, int cnt1,int [] XPoly,int [] YPoly)
{
   g.setColor(Color.black);
      for(int i=0;i<cnt1;i++)
      {

         if(XPoly[i]!=0 && YPoly[i]!=0)
         {
         if(i<cnt1-1)
         {
         g.drawLine((int)(XPoly[i]/2+20),(int)(YPoly[i]/2+20),(int)(XPoly[i+1]/2+20),
         (int)(YPoly[i+1]/2+20));
         }
         else
         {
            g.drawLine((int)(XPoly[i]/2+20),(int)(YPoly[i]/2+20),(int)(XPoly[0]/2+20),
            (int)(YPoly[0]/2+20));
         }
      }
      }

}

// Function to find the minimum coordinate with least horizontal value

public Point FindMin(Point curMin)
{
   Point tmp;
   for(int i=1; i < TmpPoint.size(); i++)
      {
         tmp = (Point) TmpPoint.elementAt(i);
         if(curMin.x > tmp.x ||
            (curMin.x == tmp.x && curMin.y > tmp.y))
               {curMin =tmp;}

         // in case of ties look at min y value
      }

      return curMin;
}


   public void paint(Graphics g)
   {

   int cnt=0,flag=0;
   String msg="";
   setLayout(new BorderLayout());

      //Drawing x and Y Axis

   g.drawString("Graph showing X & Y Coordinates", 100,550);
   g.setColor(Color.blue);
   g.drawLine(20,20,20,520);
   g.drawLine(20,20,740,20);


//Plotting the XTicks

   for(int i=20;i<=740;i=i+20)
         g.drawLine(i,15,i,25);


   for(int i=0;i<=740;i=i+80)
      {
      msg=Integer.toString(i*2);
      g.drawString(msg, i+15,10);
      }

//Plotting the YTicks

   for(int i=20;i<=520;i=i+20)
   g.drawLine(15,i,25,i);
   for(int i=80;i<=520;i=i+80)
      {
      msg=Integer.toString(i*2);
      g.drawString(msg, 5,i+15);
      }


   g.drawString("(1 unit=", 520,550);
   msg=Integer.toString(40);
   g.drawString(msg, 560,550);

   g.drawString(")",575,550);

      g.setColor(Color.red);

         msg="Y Axis";
      g.drawString(msg, 10,540);

         msg="X Axis";
      g.drawString(msg, 750,40);

   //Plotting ovals on the coordinate points
   PlotCoordinates(g);


      FindBound(g);

      }


      //Function to plot the coordinates

   public void PlotCoordinates(Graphics g)
      {
         for (int i = 0; i < XCoor.size();i++) {
      int e=((Integer)XCoor.elementAt(i)).intValue();
      int f=((Integer)YCoor.elementAt(i)).intValue();

      double tempx=e/2+20;
      double tempy=(f/2)+20;
      g.drawOval((int)tempx,(int)tempy,1,1);


    }
      }


 private static Vector XCoor = new Vector();
     private static Vector YCoor = new Vector();
     private static Vector TmpPoint = new Vector();

      HullPoints hull;
      private static final int MARGIN=30;
      private static final int DIST=  10;
      private static final int MAX=  30;


      }