Deliverable #2
Add a chart to display the statistics of each group
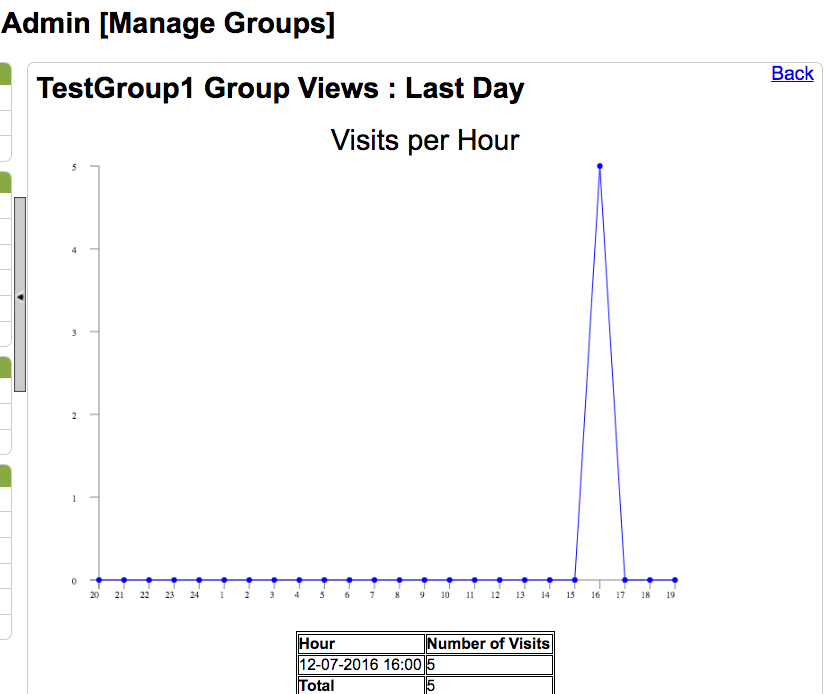
Currently, the statistics of the group including it's threads and wikis are shown in terms of total number of views. One can see total views for each item during last hour, day, month and year.
This deliverable extends the feature by showing the statistics in a chart. It spans total views into different time periods such as during the last 24 hours in a day, 30 days in a month or 12 months in a year.