Chris Pollett > Students > Pundi Muralidharan
Print View
[Bio]
[Blog]
[Deliverable 1 - WebGL Program: The Logic Behind]
[Deliverable 2 - The Study of OSM Data and Vector Tiles]
[Deliverable 3 - Importing OSM Data into Postgres Database]
[Deliverable 4 - Study of Current Tile Generators in Trend]
[CS 298 Report-Intermediate - PDF]
[CS 298 - Summary of Intermediate Results - PDF]
[CS 298 Project Source Code - ZIP]
The Final Map
Description: After the map data is fetched from the database and the shaders written for manipulating the vertices, it is finally drawn on the canvas.Much of the WebGL code for compiling and linking the C-like shader code is boilerplate and is the same for most of the programs written in WebGL. The final draw call makes use of index buffers, which specify the vertices that need to be reused. The indices are used to tell the WebGL to draw lines between the specified vertices, thereby rendering a two-dimensional map. The final draw() call is as follows:
gl.drawElements(gl.LINES, indexArray.length, gl.UNSIGNED_SHORT, 0);
The draw call thus specifies that the geometry is to be rendered in the form of lines, by drawing lines between the vertices specified by their indices.
The final Map looks like this:
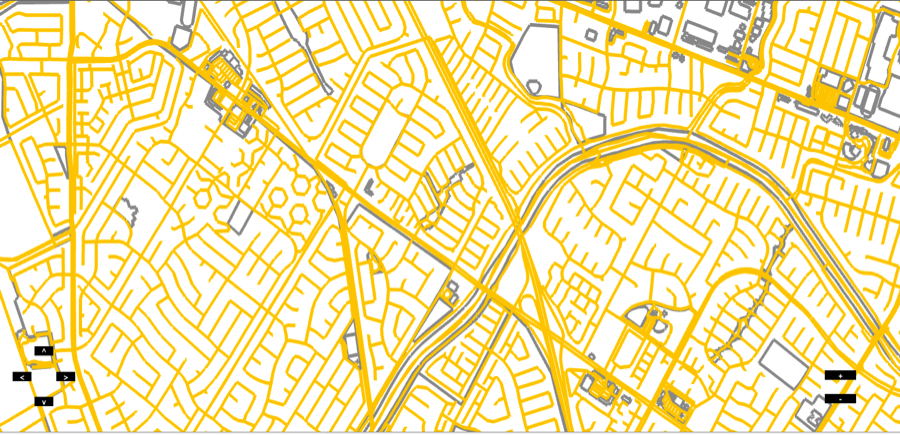
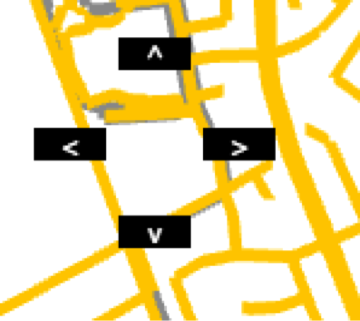
The map also has zooming and panning controls. When the user hits the zooming controls, the points are displayed by scaling them according to a scale factor which depends on the current zoom size.

To compare this map with the traditional tile servers, I set up my own tile server using mapnik and OpenLayers and rendered a tiled map for the same bounding box and zoom level. I also performed timing tests along with my professor to figure out if this project was faster and competitive than the traditional tile servers. Making a comparison between the query result time and the time taken to generate tiles, the average time taken for the former 1.87 seconds while the latter takes 3.71 seconds, which says that using this project has a time reduction of 38% approximately for data download through AJAX calls. On a real-world scenario, further comparisons between the two different methods were as follows. Considering a particular bounding box, for a particular zoom level, say 15, the traditional way of online maps would opt to get the corresponding tiles from the tile server and then render them on the browser. If the tiles are cached at different zoom levels for the whole world, then the cached tiles are returned accordingly. We could then calculate the tiles sizes (in bytes) for all the tiles returned and check if the data size returned from the query for the same bounding box and zoom level is lesser or greater.
In our approach, we could try to cache the query results. If we could pre-compute the bounding boxes and the corresponding query results for the whole world, just as the tiles are pre-computed, we could hope that the cached query data would return data that is lesser in size than the tiles. Then, the data that is sent to the browser to be drawn would be lesser, and hence would reduce the network traffic. With this argument, I calculated the byte sizes for both the tiles and the query results. Having the bounding box parameters for Newark, CA, I was able to find that while the tiles returned from my tile server were 762 KB in size (in total), the data that my query returned after truncation and compression was around 684 KB, which is an 86% reduction of data size from the original 5 MB.
Now, the comparison between the rendering times of the two methods yielded the following results. While the traditional tile servers rendered tiles in 61 ms, our approach rendered the data in 8 ms. Since we am experimenting only for one bounding box (calculated according to current position), these results are comparable. If this is extended on a larger scale and if bounding boxes and the corresponding query results are computed for the whole world, then the results might be competitive. Thus, lesser data would be sent to the browser to render and hence network traffic would be considerably reduced.