Deliverable 2 - The Study of OSM Data and Vector Tiles
This deliverable was to understand the OSM basics and 2D vectors. I have created two powerpoint presentations, one on OSM basics and one on vector tiles. I have described each in turn, below.
2.1 OpenStreetMap DataOpenStreetMap is a very large wiki of XML data about the geography of the entire planet. It is in fact, a collaborative project to create a free, editable map with the information provided by contributors. The initial map data was originally collected from scratch by volunteers performing systematic ground surveys using a handheld GPS unit and a notebook, digital camera, or a voice recorder. The data was then entered into the OpenStreetMap database. More recently, the availability of aerial photography and other data sources from commercial and government sources has greatly increased the speed of this work and has allowed land-use data to be collected more accurately by the process of digitization. When especially large datasets become available, a technical team manages the conversion and import of the data.
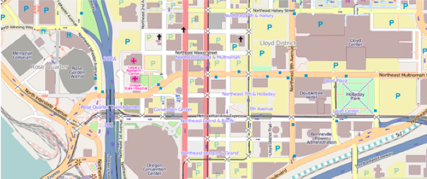 Figure: Map rendered using OSM data
The following are the data structures used primarily in OSM:
2.1.1 TagsTags are a way to represent a point or a node in the map. They are represented as key-value pairs. Examples of tags could be:
- Highway = residential
- Exit to = Durham Fy
- Cycle way = lane
- Foot = no and so on.
A tag in an OSM XML file could be written like this:
<tag k="highway" v="motorway_junction"/>
2.1.2 Nodes
A node or a point can be used to mark a particular place in the map. Nodes are marked using tags as explained before. For example, a bus-stop (node) could be marked as:
highway = bus-stop
2.1.3 Ways
Ways are represented as lines in the map. Ways could be rivers, roads, a fence, etc. A way connects two or more nodes. Ways can be depicted with the same tagging system. For example, a freeway could be tagged as:
highway = motorway
The order of nodes in which they appear specifies which way should be taken. For example: If you want to move from a node, tagged by amenity = cafe to another node, amenity = fuel, we might draw a line representing the way and tag it as highway = primary and name = Main Street. The orders in which the nodes appear also depict the traffic flow through that way.
An area is a closed way and can represent lakes, buildings, etc. For example, a plaza would be an area tagged with
highway = pedestrian and area = yes
2.1.5 Relations
Relations are groups of nodes, ways, or areas. The following are its types:
- Route: includes interstate routes, cycling routes, and bus routes
- Multipolygon: areas with multiple parts or holes
- Boundary: for administrative boundaries
- Restriction: to describe turn restrictions
There are lots of other classification in OSM and the tag representations. For example, a highway could be a motorway, or a primary, or a secondary, or a tertiary highway. Having an account with http://osm.org can help you edit the map and hence contribute.
2.2 Vector TilesVector tiles are packets of geographic data, shaped up as pre-defined tiles. For a browser to render a map, the map data is requested by the browser(client) as a set of "tiles" corresponding to square areas of land of a pre-defined size and location. The server then returns vector map data, which has been clipped to the boundaries of each tile, instead of a pre-rendered map image. Compared to an un-tiled vector map, the data transfer is reduced, because only data within the current viewport, and at the current zoom level needs to be transferred. Vector tiles for rendering OpenStreetMap data were first proposed in March 2013 and are supported by Mapnik, the most widely used renderer of OpenStreetMap data. The tile server pipeline, TileStache includes a vector tile provider called VecTiles. Deliverable 3 describes the setting up of Mapnik and TileStache for rendering geographic tiles.