Neural Net Experiments, Feedforward Networks
CS256
Chris Pollett
Oct 11, 2017
CS256
Chris Pollett
Oct 11, 2017
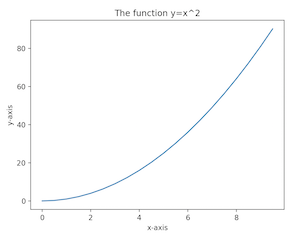
import matplotlib.pyplot as plt
import numpy as np
a = np.arange(0, 10,.5, dtype=float);
b = a * a
plt.title("The function y=x^2")
plt.xlabel("x-axis")
plt.ylabel("y-axis")
plt.plot(a,b)
plt.show()
import matplotlib.pyplot as plt
import numpy as np
a = np.arange(0, 10,.5, dtype=float);
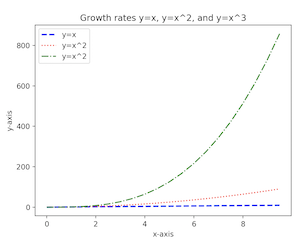
plt.title("Growth rates y=x, y=x^2, and y=x^3")
plt.xlabel("x-axis")
plt.ylabel("y-axis")
id_line, = plt.plot(a,a, color="blue",
label="y=x", linestyle='dashed', linewidth=2)
quad_line, = plt.plot(a, a**2,
color="red", label="y=x^2", linestyle='dotted')
cube_line, = plt.plot(a, a**3,
color="green", label="y=x^2",
linestyle='dashdot')
plt.legend(handles=[id_line, quad_line, cube_line],
loc=2)
#loc can be a number 1-4, number represents
#which corner
plt.show()
import matplotlib.pyplot as plt
import numpy as np
a = np.arange(0, 10,.5, dtype=float);
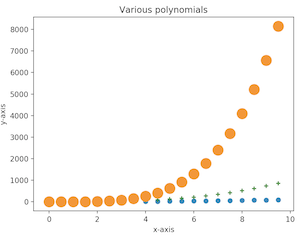
plt.title("Various polynomials")
plt.xlabel("x-axis")
plt.ylabel("y-axis")
plt.scatter(a, a**2)
plt.scatter(a, a**3,
marker="+", color="green");
plt.scatter(a, a**4, 200, marker="o");
# 200 is size in pixels
plt.show()
import matplotlib.pyplot as plt
import numpy as np
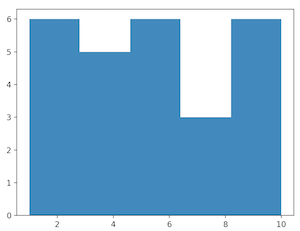
a = np.array([1,1,2,2,2,2,3,4,4,4,4,
5,5,5,5,6,6,7,8,8,9,9,9,10,10,10])
plt.hist(a, bins=5)
plt.show();
import matplotlib.pyplot as plt
import numpy as np
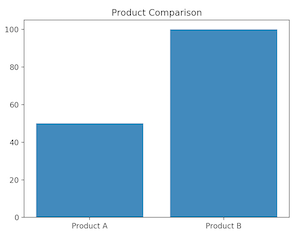
plt.title("Product Comparison")
plt.bar(["Product A", "Product B"],
[50, 100])
plt.show();
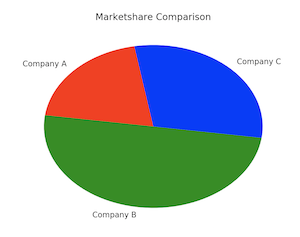
import matplotlib.pyplot as plt
import numpy as np
plt.title("Marketshare Comparison")
companies = ["Company A", "Company B",
   "Company C"]
shares = [20, 50, 30]
colors = ['red', 'green', 'blue']
plt.pie(shares, labels=companies,
    colors=colors, startangle=100)
plt.show();