Airline Performance
Analyzer
Big Data refers to the ability to efficiently query large unstructured data sets. Efficiency is gained through a query engine that breaks queries into parallel operations that are delegated to different nodes in a large network of computers. Such a system, like Hadoop, divides queries into map, filter, and reduce operations. Maps transform data from different sources into a common format. Filters remove unwanted data items, and reducers combine or collect the data items into the desired result.
Airline Performance
The US Department of Transportation keeps track of the nation's transportation systems through a massive collection of databases that can be accessed through their web site:
Anyone can query any of these databases and download the result as a CSV file.
For example, the file ONTIME.csv shows statistics on all commercial flights in California for the month of January 2015. The file contains 94803 lines. Each line represents one flight.
Here are the first few lines of the file viewed using Excel:
|
CARRIER |
FL_NUM |
ORIGIN |
ORIGIN_CITY_NAME |
DEST |
DEST_CITY_NAME |
CRS_DEP_TIME |
DEP_TIME |
DEP_DELAY_NEW |
ARR_DELAY_NEW |
CANCELLED |
DIVERTED |
|
AA |
1 |
JFK |
New York, NY |
LAX |
Los Angeles, CA |
900 |
855 |
0 |
7 |
0 |
0 |
|
AA |
1 |
JFK |
New York, NY |
LAX |
Los Angeles, CA |
900 |
850 |
0 |
0 |
0 |
0 |
|
AA |
1 |
JFK |
New York, NY |
LAX |
Los Angeles, CA |
900 |
853 |
0 |
0 |
0 |
0 |
|
AA |
1 |
JFK |
New York, NY |
LAX |
Los Angeles, CA |
900 |
853 |
0 |
0 |
0 |
0 |
|
AA |
1 |
JFK |
New York, NY |
LAX |
Los Angeles, CA |
900 |
853 |
0 |
0 |
0 |
0 |
|
AA |
1 |
JFK |
New York, NY |
LAX |
Los Angeles, CA |
900 |
856 |
0 |
25 |
0 |
0 |
|
AA |
1 |
JFK |
New York, NY |
LAX |
Los Angeles, CA |
900 |
859 |
0 |
0 |
0 |
0 |
|
AA |
1 |
JFK |
New York, NY |
LAX |
Los Angeles, CA |
900 |
856 |
0 |
0 |
0 |
0 |
|
AA |
1 |
JFK |
New York, NY |
LAX |
Los Angeles, CA |
900 |
901 |
1 |
6 |
0 |
0 |
|
AA |
1 |
JFK |
New York, NY |
LAX |
Los Angeles, CA |
900 |
903 |
3 |
0 |
0 |
0 |
|
AA |
1 |
JFK |
New York, NY |
LAX |
Los Angeles, CA |
900 |
854 |
0 |
0 |
0 |
0 |
|
AA |
1 |
JFK |
New York, NY |
LAX |
Los Angeles, CA |
900 |
853 |
0 |
0 |
0 |
0 |
|
AA |
1 |
JFK |
New York, NY |
LAX |
Los Angeles, CA |
900 |
854 |
0 |
0 |
0 |
0 |
|
AA |
1 |
JFK |
New York, NY |
LAX |
Los Angeles, CA |
900 |
856 |
0 |
0 |
0 |
0 |
|
AA |
1 |
JFK |
New York, NY |
LAX |
Los Angeles, CA |
900 |
852 |
0 |
0 |
0 |
0 |
|
AA |
1 |
JFK |
New York, NY |
LAX |
Los Angeles, CA |
900 |
900 |
0 |
0 |
0 |
0 |
|
AA |
1 |
JFK |
New York, NY |
LAX |
Los Angeles, CA |
900 |
852 |
0 |
0 |
0 |
0 |
|
AA |
1 |
JFK |
New York, NY |
LAX |
Los Angeles, CA |
900 |
916 |
16 |
1 |
0 |
0 |
Here is the explanation of some of the non-obvious columns:
CRS_DEP_TIME = the time the flight was supposed to depart
DEP_TIME = the time it did depart
DEP_DELAY_NEW = the number of minutes late departing
ARRIVAL_DELAY_NEW = the number of minutes late arriving
CANCELLED = was the flight cancelled (1 = yes 0 = no)
DIVERTED = was the flight diverted (1 = yes 0 = no)
Who's the Worst?
Create a class called AirlinePerformance:
class AirlinePerformance {
public static Map<String,
Integer> getTotalDelays(String fileName) { ??? }
public static Map<String, Double>
getAverageDelays(String fileName) { ??? }
public static displayTables(String
fileName) {
Map<String, Integer> totals = getTotalDelays(fileName);
Map<String, Double> averages =
getAverageDelays(fileName);
System.out.println("total
delays = " + totals);
System.out.println("average
delays = " + averages);
System.out.println("... and the
worst carrier is: " + ???);
}
public static void main(String args[])
{
displayTables("ONTIME.csv");
}
}
Using Java 8 Streams
The goal of this project is to gain experience creating pipelines using Java 8 Streams.
The implementation of getTotalDelays should create a pipeline:
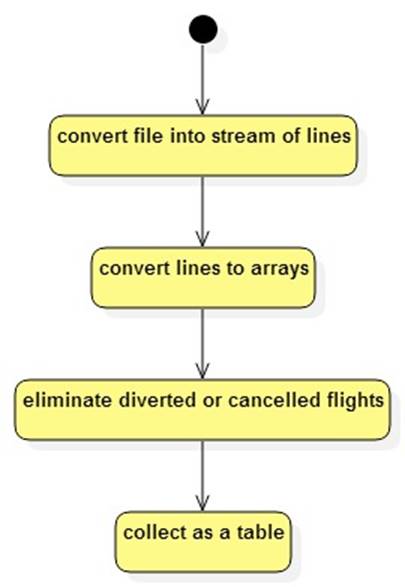
Details of using streams to create pipelines can be found here: Stream Processing in Java 8. Streams depend heavily on lambdas (function-objects) which is another feature of Java 8: Lambdas in Java 8.
While different stages of the pipeline can't be deployed to different JVMs, if the pipelines are carefully specified, the JVM can distribute stages to different cores on multi-core machines.
Hints
1. To collect a stream into a map use:
stream.collect.(Collectors.toMap(lambda1, lambda2, lambda3) )
where:
lambda1 extracts the table key from a stream element
lambda2 extracts the table value from a stream element
lambda3 combines a new value with an existing value
2. Be careful. There are commas between city names and state abbreviations. These show up as single columns in Excel.
3. Computing average delays in a pipeline is tricky because both the total delay and the number of flights is needed for each carrier. How can this be done without two sequential pipelines? One idea is to collect lines into a table of type:
Map<String, Stats>
Where
class Stats {
public int totalDelay;
public int numFlights;
}
For each line locate the Stats value for the carrier, then update the fields. At the end of the method convert the table into the desired table. (This last step isn't part of the pipeline.)