Cultural Dissemination
A culture can be viewed as a collection of ethnic traits: norms, customs, technologies, laws, politics, language, art. Cultural dissemination refers to the tendency for one culture to adapt some of the traits of a neighboring culture.
But why are there different cultures today? Why haven't all cultures blended into one universal culture by this time? Why do cultural islands form? Is there some natural dynamic that explains this?
Assimilation Simulator (AS)
AS is a NetLogo program that allows users to simulate the spread of cultural traits. In AS the only agents are NetLogo patches. Each patch represents an ethnic region. The cultural traits of an agent are represented by a list of integers.
For example, suppose we are only interested in five cultural traits: economy, language, technology, political organization, and religion. For simplicity, let's assume that each of these traits has only five possible values. For example:
In this case every patch owns a list containing five integers in the range zero to four inclusive. For example, here is a snapshot of nine patches at a particular moment in time:
![]()
Inhabitants of the patch in the middle are farmers (economy = 2). They speak a Nahwatal language (language = 2). They use bronze tools and weapons (technology = 1). Politically, they are a democracy (organization = 3). And they are godless (religion = 1).
Measuring Cultural Similarity
We can define the cultural similarity between two cultures as the percentage of traits they have in common. For example, the middle patch has no traits (0%) in common with its northwestern and northeastern neighbors, one trait (20%) in common with its neighbor to the north (religion), west (technology), east (organization), and southeast (religion), and two traits (40%) in common with its neighbor to the southwest (technology and religion) and to the south (economy and organization).
Which two cultures shown are the most similar?
Cultural Adaptation
During each cycle (cycle = year, decade, century, etc.) each patch, P, is given a chance to borrow a cultural trait of one of its neighbors. P randomly picks one of its (three to nine) neighbors, N. If the cultural similarity between P and N is greater than some randomly generated percentage, then P randomly picks one of N's traits, t, and replaces its corresponding trait by t.
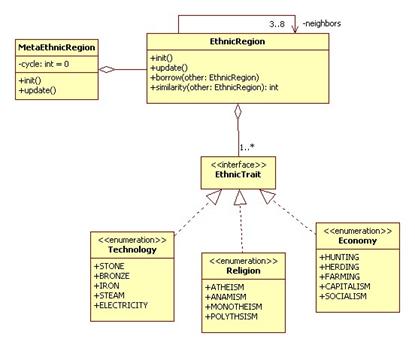
Domain Model
Here's a class diagram that models some of the concepts we have discussed:
Using AS
The interface for AS is simple. It consists of an initialization button, a run button, a cycle counter, and a view.
Clicking the init button initializes the simulation. This causes each patch to initialize itself. A patch initializes itself by adding a prescribed number of random traits to its traits list. The patch sets its color to a color given by calling the getColor function. The domain of this function is the collection of all possible lists of ethnic traits. The range is the NetLogo color space, which consists of three floats ranging from 0 to 1 and representing the amount of red, green, and blue, respectively. For example, if every patch has a list of K traits, and if the value of each trait is in the range from 0 to N, inclusive, then the type of setColor is:
setColor: [0, N]K -> [0, 1]3
This map is continuous in the sense that if two ethnic trait lists are similar in the manner described above, then the corresponding colors will be similar.
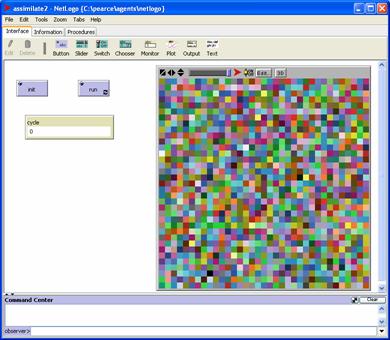
Since the traits are initially random, the colors of the patches are random.
Cycle = 0
Here's a screen shot just after initialization:
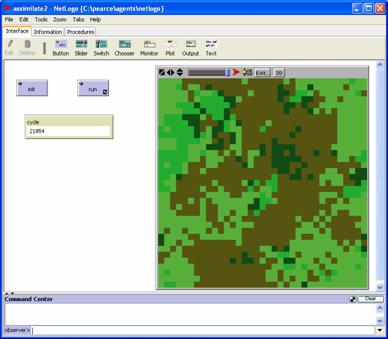
Cycle = 8502, Green Hegemony
Clicking the run button initially starts the simulation. The cycle counter starts updating and the color patterns begin shifting. Subsequently clicking on the run button pauses and resumes the simulation.
Here's what the world looks like after 8502 cycles:
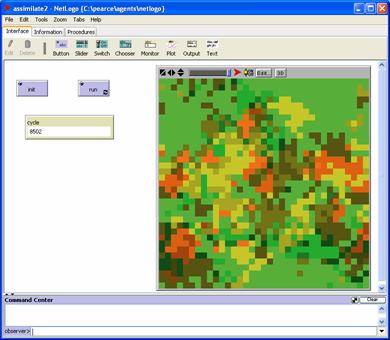
Notice the hegemony of the greenish cultures.
Cycle = 12352, The Yellow (and Orange) Peril
Times change, the introduction of TV, Internet, cars, and jumbo jets allows culture to disseminate in ways that are difficult to predict. Here's what our world looks like after 12353 cycles:
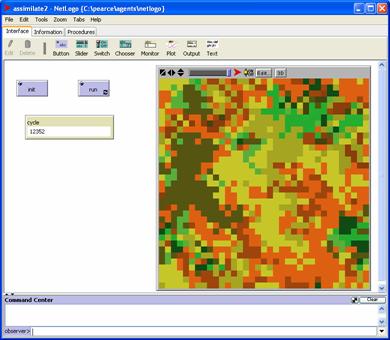
Note that the greenish cultures are in abeyance while the yellowish and orange-ish cultures are beginning to dominate.
Cycle = 2184, The Greens are Back!
Cycle = 26907, The World is Green!
Imagine a day when all people wear Michael Jordan shoes, even Earth's president. Everyone is a born-again Christian, and there is a MacDonald's on the summit of Everest.
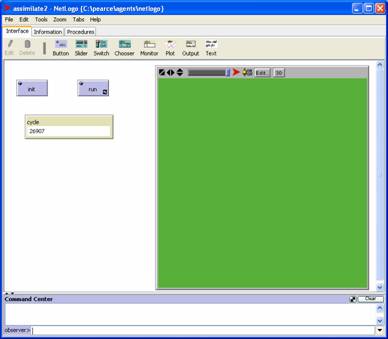
Of course my getColor function is defined in such a way that it is possible that there could still be spontaneous eruptions of non-green cultural traits.
Implementation of AS
Several global variables are used to control and monitor the number of traits, the range of trait values, and the cycle:
globals [numTraits maxTraitValue cycle]
Here are the initial settings used above:
to init-globals
set numTraits 5
set maxTraitValue 5 ; 0 <=
traitValue <= maxTraitValue
set cycle 0
end
Each patch owns a list of cultural traits:
patches-own [traits] ; length = numTraits
Each patch initializes itself by adding random values to its traits list and then setting its color to the value of getColor:
to init-patch
set traits []
repeat numTraits
[set traits (lput random
(maxTraitValue + 1) traits)]
set pcolor getColor
end
Initializing all patches (this is called when the init button is clicked) clears the user interface, initializes all globals, then initializes each patch:
to init-patches
ca
init-globals
ask patches [init-patch]
end
Updating patches (this is called repeatedly when the run button starts or resumes the simulation) updates each patch, then increments the cycle counter:
to update-patches
ask patches [update-patch]
set cycle cycle + 1
end
As described earlier, updating a patch involves picking a random neighbor and, if the neighbor is similar enough, borrowing a random trait.
Toward this end it might be helpful to define the following functions:
; continuously maps self's traits to some color
to-report getColor
locals [r g b]
set r ?
set g ?
set b ?
report rgb r g b
end
; measures the % similarity between self & other
to-report culturalSimilarity [other]
report ?
end
The second method is easy to implement, the first is tricky and requires some thought. There may be several implementations.
Project
A. Finish the implementation of AS.
B. Add text controls that allow the user to adjust the values of numTraits and maxTraitValue.
C. For each trait, add a plotter that shows how many patches have that trait.
D. Add a run-for button that runs the simulation for N steps before it pauses and updates the view. Add a text control that allows the user to specify the value of N.
E. Fill in the information tab following the style of some of the other NetLogo models.
Alternative Project:
Instead of eight neighbors, only consider four: north, south, east, and west. Instead of colors representing cultural traits, draw lines between patches. The thickness of the line should be inversely proportional to the cultural similarity between the patches.
References
The idea for this project came from Robert Axelrod's essay Disseminating Culture, which can be found in his book: The Complexity of Cooperation: Agent-based Models of Competition and Collaboration.